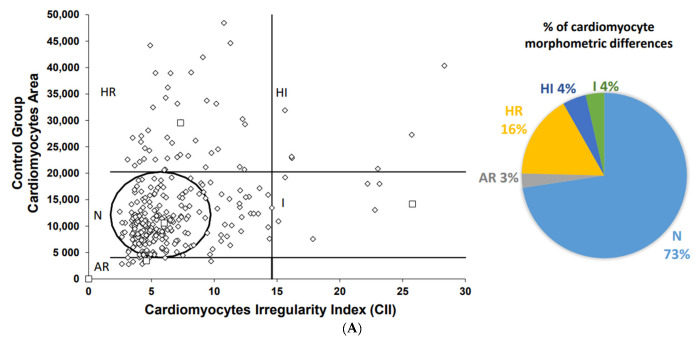
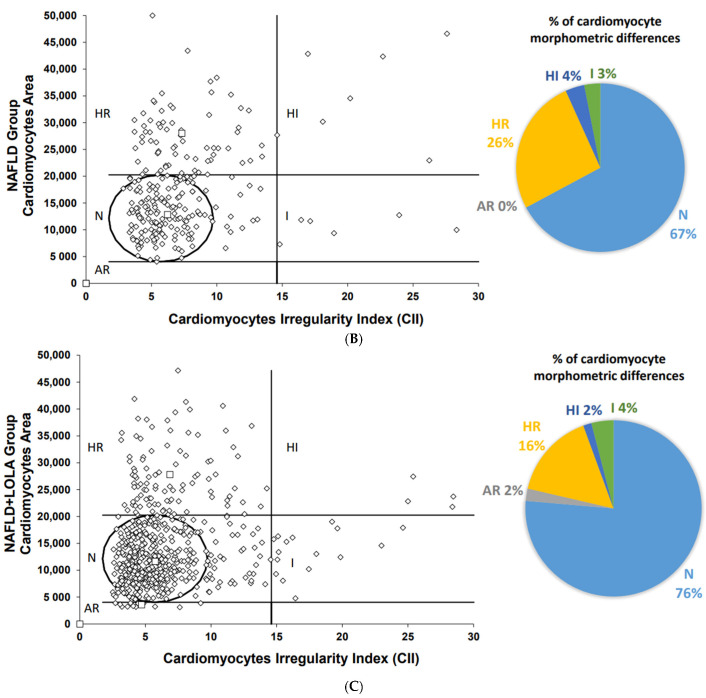
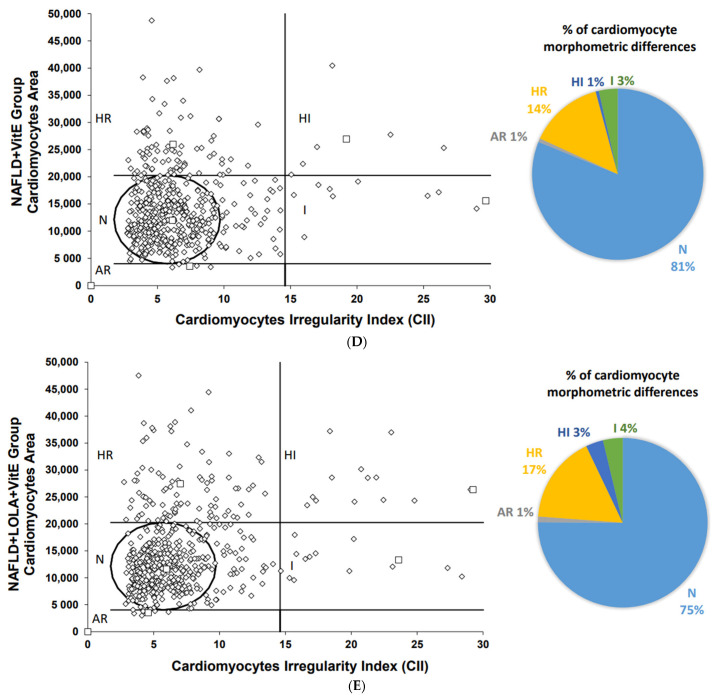
Figure 4.
Cardiomyocytes morphometric analysis. The area and cross-sectional shape of cardiomyocytes were determined from images of hematoxylin and eosin-stained tissue. Dot plot of cardiomyocytes area vs. cardiomyocytes irregularity index in (A) Control; (B) NAFLD; (C) NAFLD+LOLA; (D) NAFLD+VitE, and (E) NAFLD+LOLA+VitE. Each dot represents a population of cardiomyocytes with different morphometry. Data expressed in percentage (%). AR: atrophic regular; HI: hypertrophic irregular; HR: hypertrophic regular; N: normal area and shape, I: irregular area and shape.


