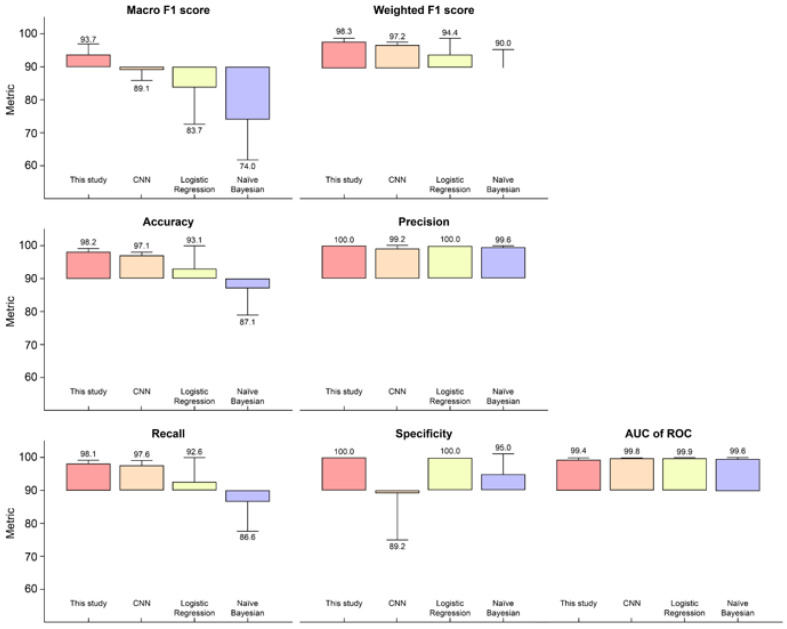
Figure 3.
Performance comparisons of NSCLC prediction model with alternative classifier models. Pairwise comparisons of the implemented algorithm performances were analyzed via five-fold cross-validation. To improve discrimination, the metric cut-off was set at 90%. The standard deviation of each performance is illustrated by a vertical error bar. AUC of ROC denotes area under the receiver operating characteristic curve.

