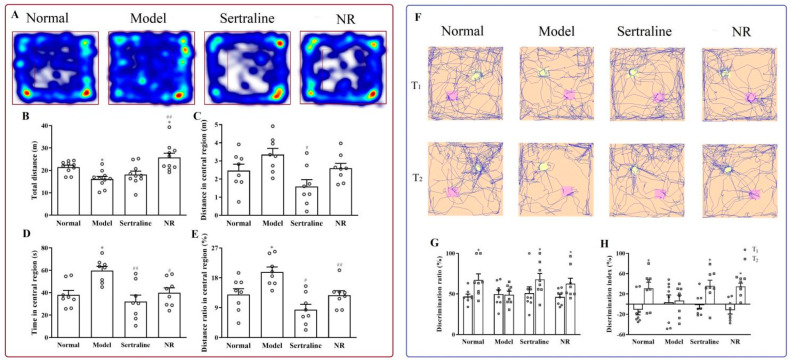
Figure 8.
Improvement of locomotor activity and the cognitive function with NR treatment in rats. (A) Heatmap and typical tracks in OFT. (B) Distance traveled overall in OFT. (C) Distance covered in the central region. (D) Time spent in the center region. (E) Distance ratio in the center region. (F) Typical tracks in NORT. (G) DR in NORT. (H) DI in NORT. * p < 0.05 vs normal group; # p < 0.05, ## p < 0.01 vs. model group in Figure 8B−E. Data in Figure 8G,H were analyzed using t-tests. * p < 0.05 vs. T1 in DR (Figure 8G) and in DI (Figure 8H).

