Figure 4.

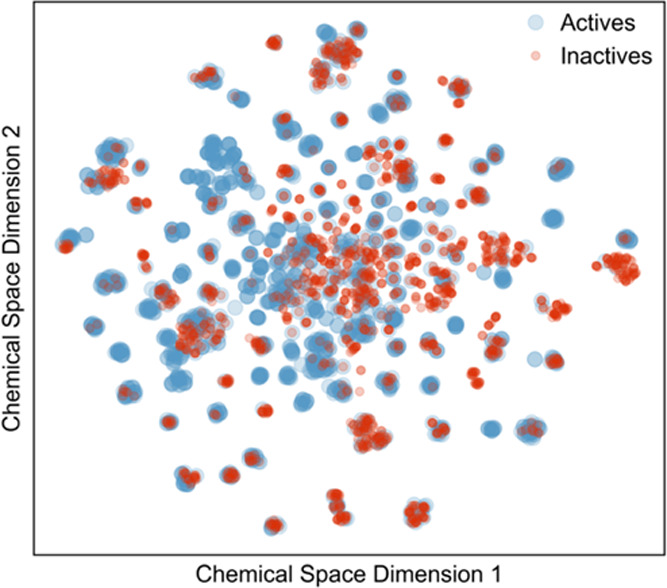
t-SNE distribution of chemical diversity of both active (blue) and inactive (red) compounds calculated from t-SNE. Active compounds were shown to have higher diversity.

t-SNE distribution of chemical diversity of both active (blue) and inactive (red) compounds calculated from t-SNE. Active compounds were shown to have higher diversity.