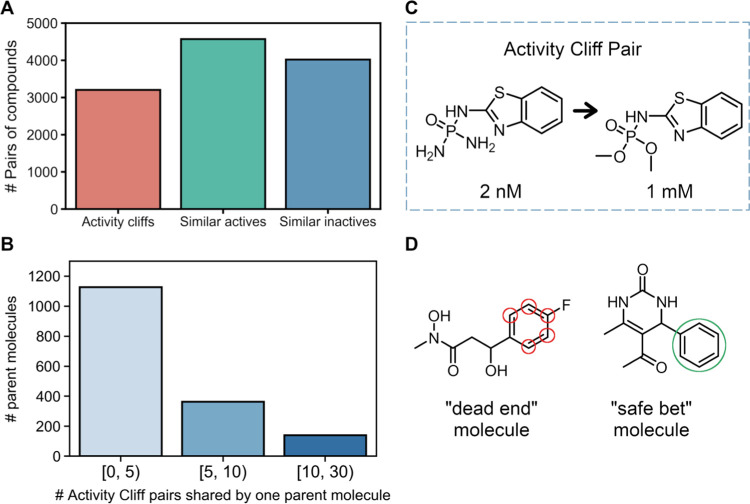
Figure 9.
(A) Distribution of the different types of similar compounds in the data set. (B) Compounds that are involved in activity cliffs, and the corresponding distribution of activity cliff pairs per compound. (C) Example of an activity cliff pair where switching two amines for two methoxy groups produces a loss of activity by several orders of magnitude. (D) Examples of a “dead end” compound and a “safe bet” compound (additional information in the text). The red and green circles indicate positions where modifications led to loss and gain of activity, respectively.

