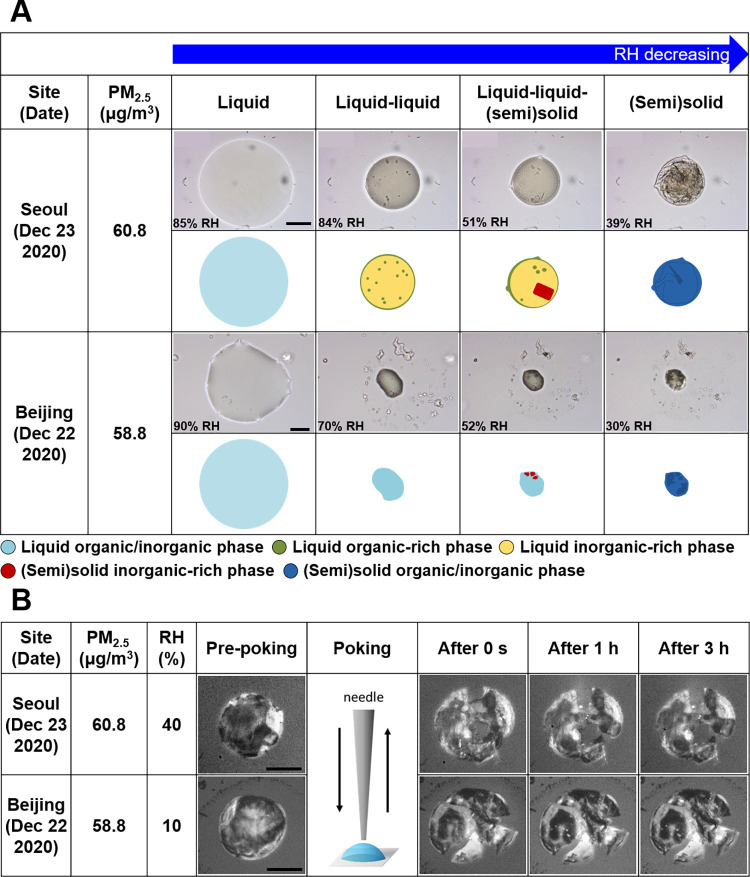
Figure 1.
Morphology and phase behavior of PM2.5 in Seoul and Beijing. (A) Optical images upon dehydration of PM2.5 samples were the highest daily average concentration in Seoul and Beijing at 290 K. Illustrations are given for interpretation of the optical images. Light blue: single liquid mixed organic/inorganic phase; green and yellow: liquid organic-rich and liquid inorganic-rich phases, respectively; red: (semi)solid inorganic-rich phase; and dark blue: (semi)solid organic/inorganic phase. (B) Optical images at 293 K on pre-poking, poking, and post-poking of the same PM2.5 filter samples as shown in (A). The solid black scale bars in (A) and (B) indicate 20 μm.

