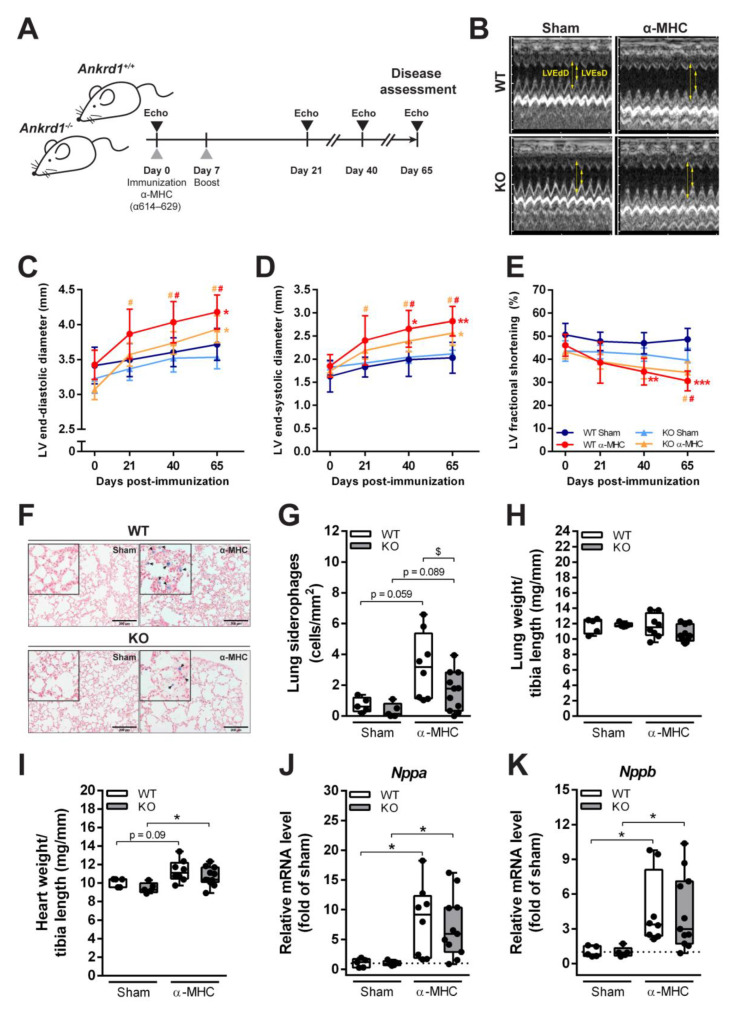
Figure 1.
Development of DCM and HF in response to EAM induction. (A) Experimental design scheme. (B) Representative images of M-mode echocardiograms at the short parasternal axis of sham- and α-MHC-immunized WT and Ankrd1 KO mice hearts 65 days pi. Yellow arrows indicate LVEdD—left ventricular end-diastolic dimension and LVEsD—left ventricular end-systolic dimension. (C–E) Echocardiographic parameters of mice hearts during the 65-day time course. LV—left ventricular. Data represented as mean ± 95% CI. *—marks statistically significant differences from respective sham, #—differences from day 0, the color of the mark corresponds to the colors of the groups. *,# (p < 0.05), **,## (p < 0.01), *** (p < 0.001)—marks statistically significant differences, by robust ANOVA followed by Lincon post hoc. (F) Representative Prussian blue staining of lung sections (scale bar – 200 µm) showing HF cells—siderophages (blue, denoted with black arrows) in the lung parenchyma of sham- and α-MHC-immunized mice and (G) quantitative analysis of their distribution in the lung tissue. (H) Lung weight to tibia length ratios. (I) Heart weight to tibia length ratios. (J,K) Quantitative RT-PCR analysis of Nppa and Nppb transcripts levels, data were normalized to corresponding 18S rRNA levels and expressed as the fold change versus the corresponding sham control; the dotted line represents sham levels. WT-Sham (n = 5), WT-α-MHC (n = 8), KO-Sham (n = 5) and KO-α-MHC (n = 11). Data represented as box-plots depicting median ± IQR, black dots denote individual animals. * (p < 0.05), ** (p < 0.01), *** (p < 0.001)—marks statistically significant differences, by robust ANOVA followed by Lincon post hoc. $ (p < 0.05)—marks statistically significant differences between α-MHC-immunized groups, by ANCOVA (LVEdD was used as a covariate) followed by EMMs post hoc.

