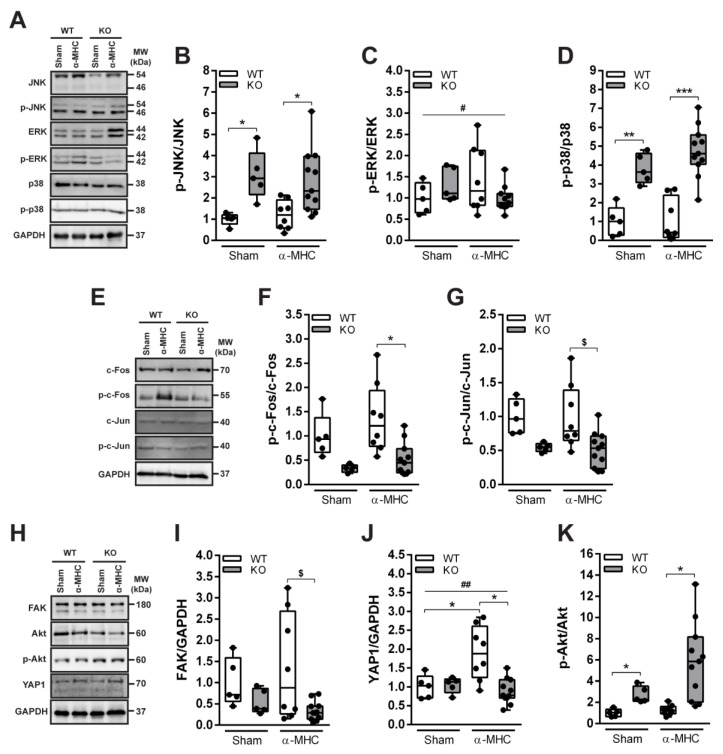
Figure 3.
Western blot analysis of the MAPK/AP1 and mechanosensing-related proteins (FAK, Akt, and YAP1) levels in mice 65 days pi (post-MC DCM stage). (A) Representative immunoblots and (B–D) quantification analysis of MAPK’s JNK, ERK, and p38 proteins’ activation. (E) Representative Western blot and (F,G) quantitative densitometric analysis of AP1 components c-Fos and c-Jun proteins phosphorylation. (H) Representative immunoblots and (I–K) quantification of FAK, Akt and YAP1 proteins. WT-Sham (n = 5), WT-α-MHC (n = 8), KO-Sham (n = 5) and KO-α-MHC (n = 11). GAPDH served as a loading control. Data are represented as the median ± IQR, black dots denote individual animals. * (p < 0.05), ** (p < 0.01), *** (p < 0.001) marks statistically significant differences, # (p < 0.05), ## (p < 0.01) marks statistically significant differences in interaction between genotype and immunization, by robust ANOVA followed by Lincon post hoc. $ (p < 0.05) marks statistically significant differences between α-MHC-immunized groups, by ANCOVA (Gross score was used as a covariate) followed by EMMs post hoc.

