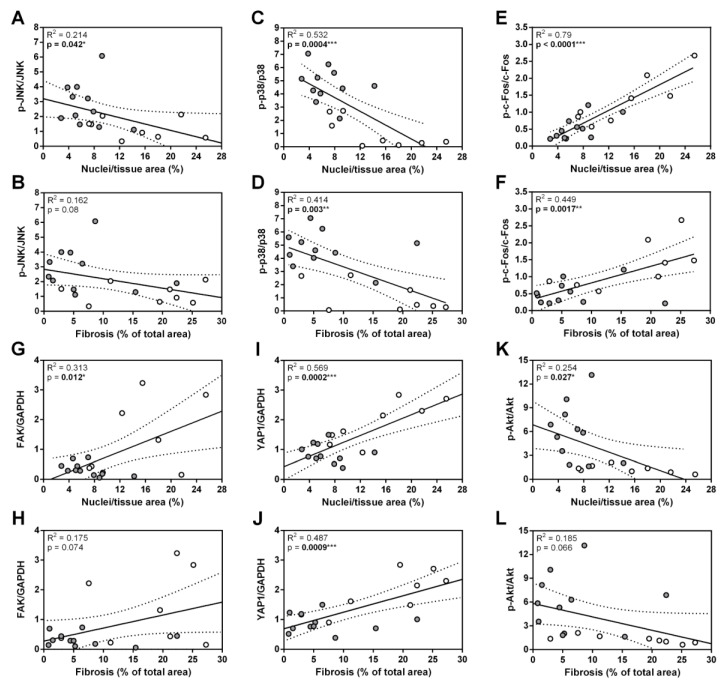
Figure 5.
Summarized interactions between heart damage and the levels of proteins found in mice during post-MC DCM (65 days pi). Linear regressions of (A) p-JNK/JNK, (C) p-p38/p38, (E) p-c-Fos/c-Fos, (G) FAK/GAPDH, (I) YAP1/GAPDH, (K) p-Akt/Akt on Nuclei/tissue area (cellular infiltration). Linear regressions of (B) p-JNK/JNK, (D) p-p38/p38, (F) p-c-Fos/c-Fos, (H) FAK/GAPDH, (J) YAP1/GAPDH, (L) p-Akt/Akt on Fibrosis. The WT-α-MHC (white dots) and Ankrd1 KO- α-MHC (gray dots) groups were combined. The regression line is represented within a 95% confidence interval. The coefficients of determination (R2) from linear regression analysis and p-values are shown on the graphs. * (p < 0.05), ** (p < 0.01), *** (p < 0.001) marks statistically significant correlations.

