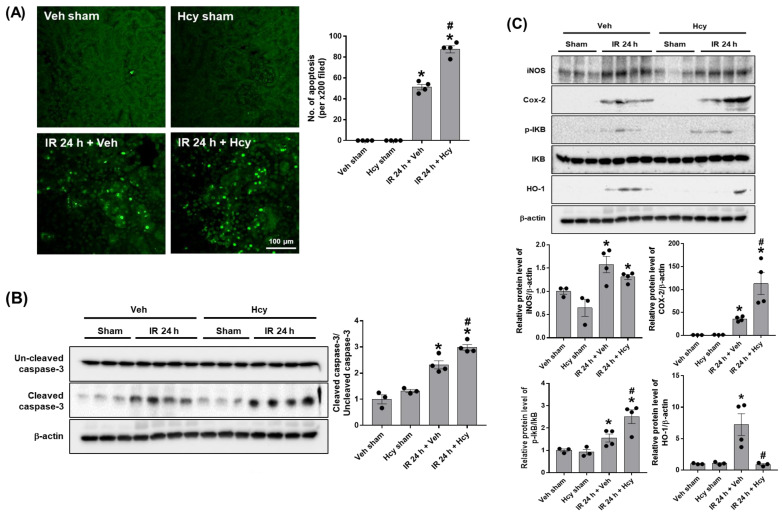
Figure 3.
Hcy exacerbates renal IR-induced tubular apoptosis in the kidney. The renal tubular apoptosis was determined by TUNEL staining and the numbers of apoptotic cells per 200× field image were counted (A). The expression of uncleaved and cleaved caspase-3 was determined by Western blot analysis and the quantification was shown (B). The expression levels of iNOS, Cox2, p-IκB, IκB, and HO-1 were determined by Western blot analysis and the quantirication was shown (C). Data are presented as the mean ± SEM. * p < 0.05 vs. sham mice; # p < 0.05 vs. IR mice. Black dots indicate individual data points. Scale bar, 100 μm.

