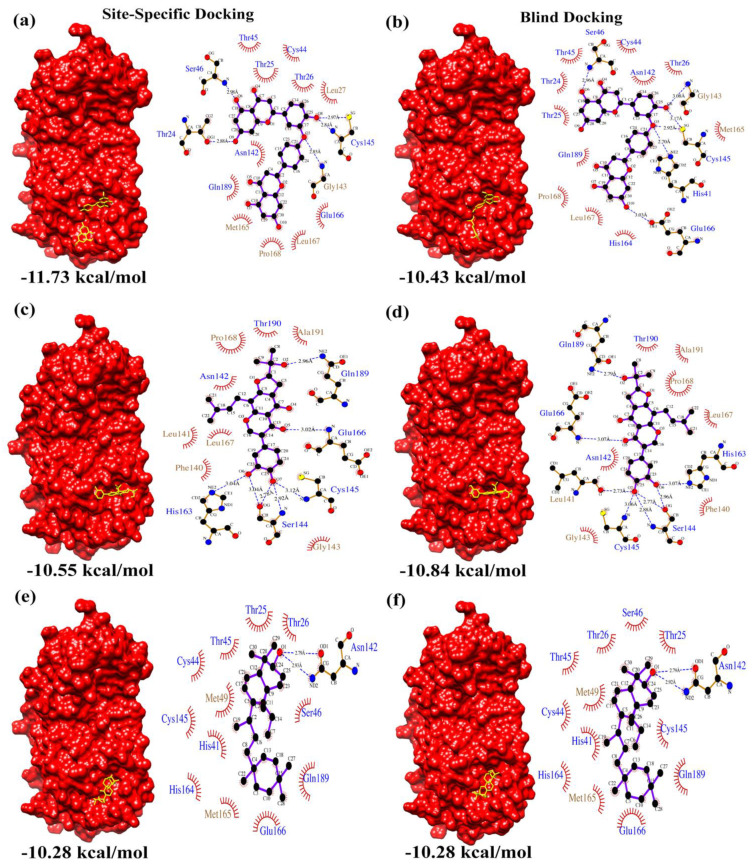
Figure 4.
NP-lib docking summary. Surface representation of Mpro complexed with (a,b) NP1, (c,d) NP2 and (e,f) NP3 resulting from site-specific and blind docking studies, respectively. The corresponding LigPlot interaction maps (polar residue names in blue font and non-polar residue names in brown font) are shown adjacent to the complexes.

