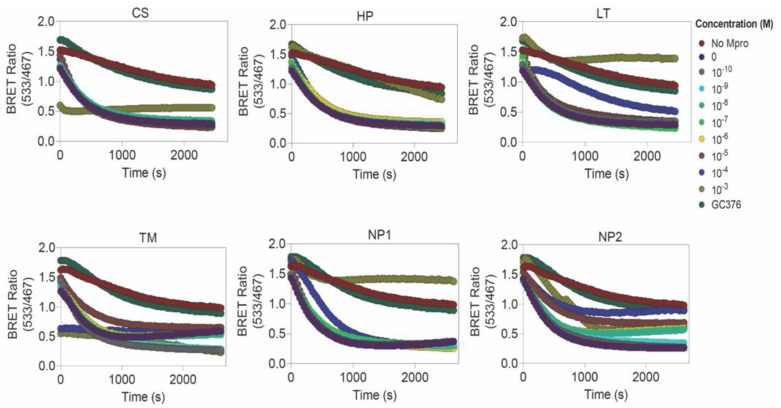
Figure 5.
Screening of SARS-CoV-2 Mpro inhibitors using a BRET-based sensor. Graph showing time-dependent difference in BRET ratio for various concentrations (10−3 to 10−10 M) of each inhibitor (CS: Ciclesonide, HP: Hesperidin, LT: Losartan, TM: Telmisartan, NP1: 2,3,2″,3″-Tetrahydroochnaflavone and NP2: Furowanin A) along with GC376 as the control. Graphs also show the decrease in BRET in the presence of Mpro and absence of inhibitors.

