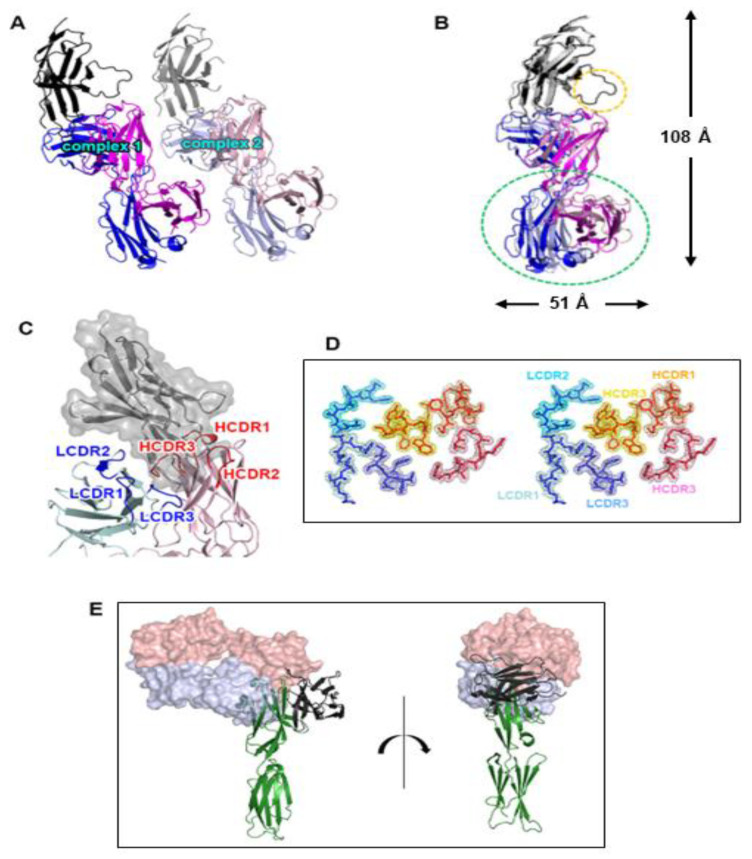
Figure 1.
Overall structure of the PD-1/cemiplimab complex. (A) Two copies of the complex in an asymmetric unit with a pseudo-translational symmetry. (B) Superposition of the two copies for comparison. The displacement of the constant region of the cemiplimab Fab is indicated by a green dotted ellipse. The difference in the C’D loop between the two copies of the complex is indicated by a yellow dotted ellipse. The dimensions of the complex structure are presented. In (A) and (B), PD-1, heavy, and light chains of cemiplimab are colored black, blue, and purple, respectively. (C) The CDR loops of cemiplimab in the complex structure. The CDRs within the light and heavy chains are colored blue and red, respectively. PD-1 is colored gray with a partially transparent surface model. (D) Stereoscopic view of 2fofc electron density map on the CDR loops calculated at 1.98 Å resolution and 1.3 σ contour level. (E) Superposition of the PD-1 protein within the cemiplimab/PD-1 and PD-L1/PD-1 complexes. Cemiplimab binding blocks the PD-1/PD-L1 interaction through steric occlusion. The cemiplimab Fab is represented as a partially transparent surface model. The heavy and light chains of cemiplimab are colored red and blue, respectively. PD-1 and PD-L1 are colored green and black, respectively.

