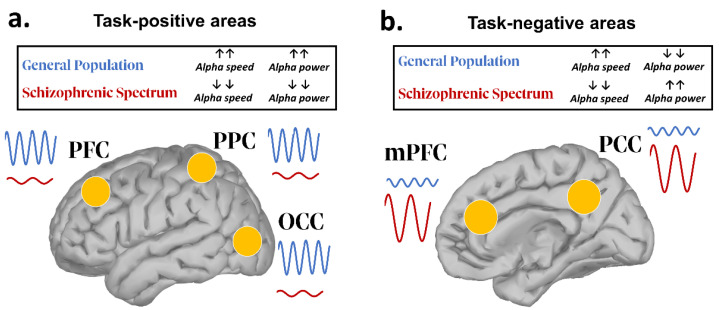
Figure 1.
Graphical representation summarizing the main findings on resting-state alpha power in SSD (relative to healthy individuals). The left panel (a) depicts alpha oscillatory patterns relative to task-positive areas, while the right panel (b) depicts those relative to task-negative regions (largely overlapping with DMN’s nodes). Upward and downward arrows indicate respectively an increase or a decrease in alpha power or frequency speed. As for the former areas, alpha power is decreased, while the latter show an overall increase of such oscillatory index. PFC (prefrontal cortex); PPC (posterior parietal cortex); OCC (occipital cortex); mPFC (medial prefrontal cortex); PCC (posterior cingulate cortex).

