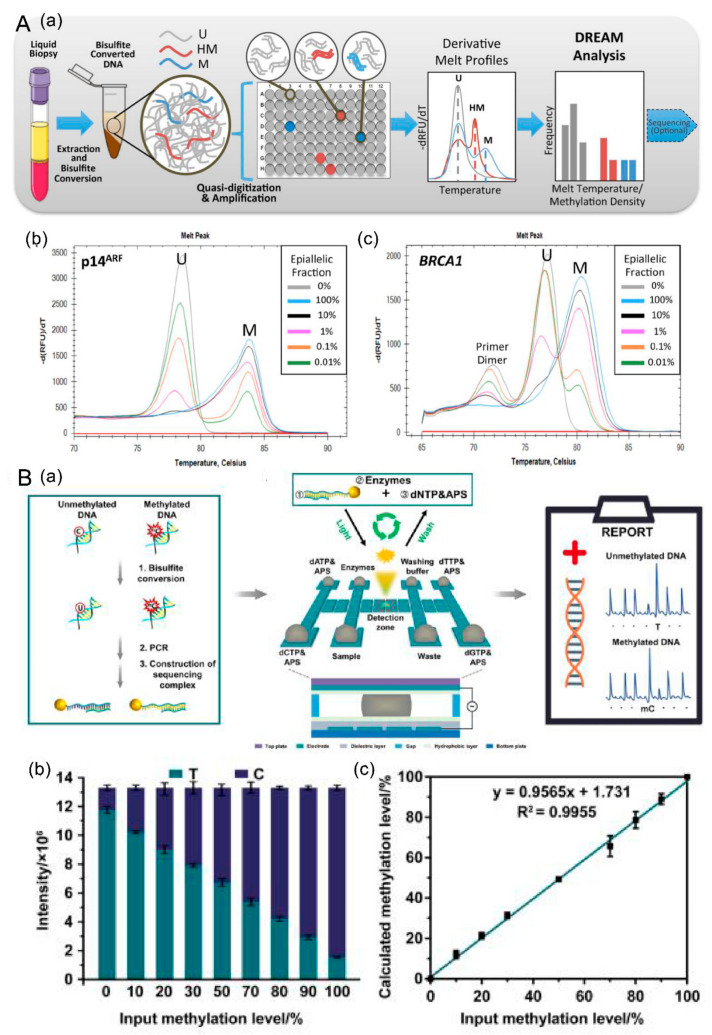
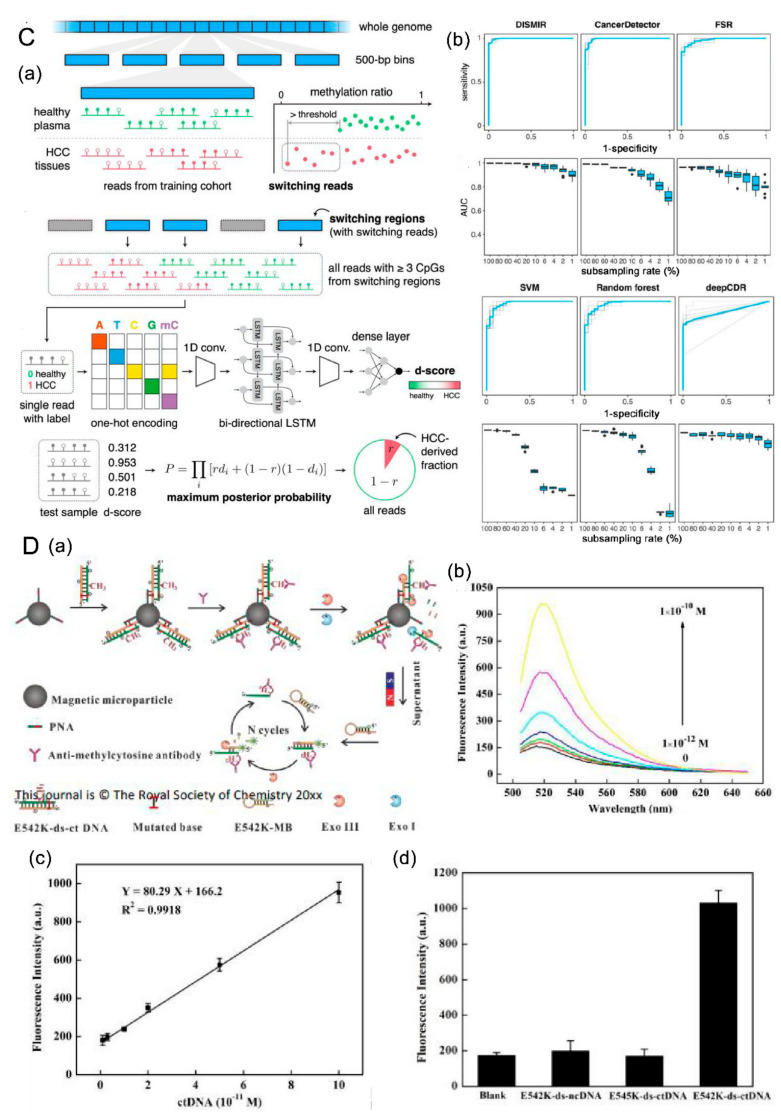
Figure 4.
Novel ctDNA methylation technologies. (A): Discrimination of Rare EpiAlleles by Melt developed by Thomas. et al. [87]. (Aa) DREAMing: analysis of epigenetic heterogeneity at single-copy sensitivity and single-CpG-site resolution. DNA is extracted from a liquid biopsy and undergoes bisulfite treatment (BST). (Ab,Ac) DREAMing primers optimized for high sensitivity. (Ab) for the p14ARF locus at various genomic DNA methylated total epiallelic fractions. (Ac) for the BRCA1 locus at various genomic DNA methylated total epiallelic fractions. Both assays exhibit sensitivities that provide detection of epiallelic fractions of 0.01% or lower. (B): A method based on pyrosequencing and digital microfluidics [89]. (Ba) schematic representation of the DNA methylation analysis based on DMF. (Bb) histogram of the signal intensities of T/C at various methylation levels for the first methylation site. (Bc) Linear relationship for various levels of input methylation levels for the first methylation site. Data are presented as mean ± SD from triplicate samples. (C): DISMIR based on ultra-low-depth WGBS data [88]. (Ca) Overview of DISMIR. (Cb) results of DISMIR and other methods on HCC diagnosis. (D): Dual-recognition-based determination grounded on peptide nucleic acid (PNA) and terminal protection of small-molecule-linked DNA (TPSMLD) [90]. (Da) the mechanism of the dual-recognition fluorescence biosensor for E542K-ds-ctDNA. (Db) fluorescence spectra of the dual-recognition fluorescence biosensor upon the addition of increasing concentration of E542K-dsctDNA. (Dc) calibration curve for E542K-ds-ctDNA detection. (Dd) bar chart of the fluorescent intensities in the presence of different DNA sequences.


