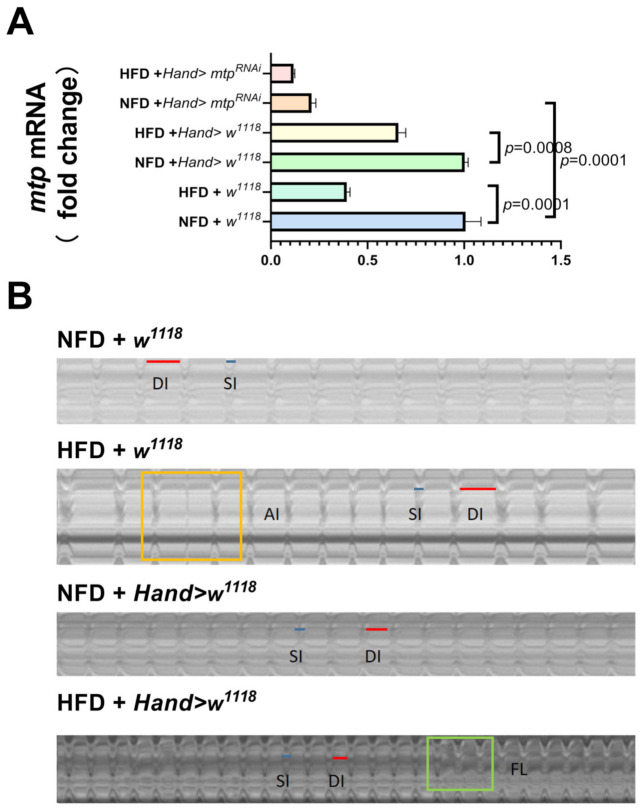
Figure 4.
(A) Relative expression levels of mtp in Drosophila cardiomyocytes. mtp expression in Drosophila cardiomyocytes was significantly higher in the NFD group than in the HFD group. The test sample consisted of about 50 isolated hearts from the 10-day-old virgin flies. (B) M-mode ECGs under different treatments, the blue line is the systolic interval, and the red line is the diastolic interval; arrhythmia is marked in a yellow rectangle and fibrillation in a green rectangle. The intercept time for each group of M-mode ECGs was 10 s. In (A), one-way ANOVA was used to identify differences between the strains of Drosophila. LSD was used for post hoc testing.

