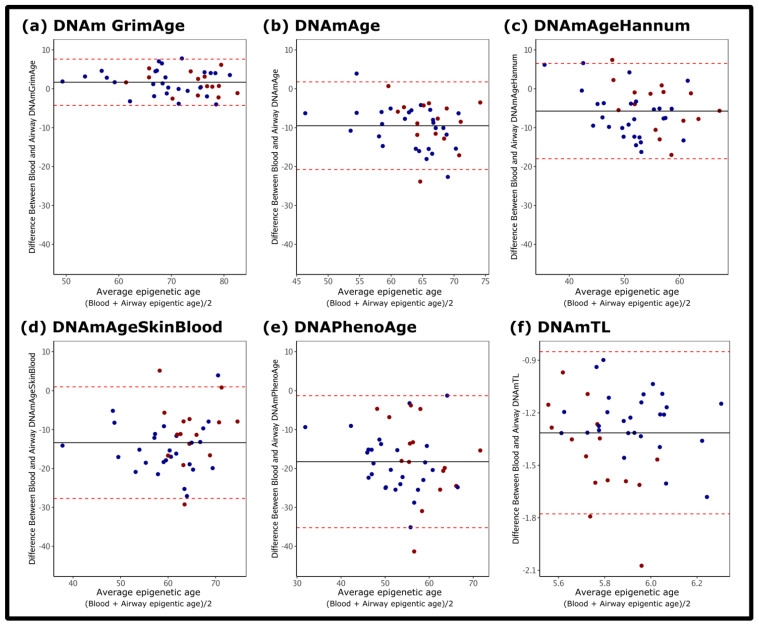
Figure 1.
Difference between airway epithelial and blood epigenetic age. Bland–Altman Plots show the difference between the measurements (y-axis) and average values for the blood and airway epigenetic age (x-axis) for: (a) DNAmGrimAge; (b) DNAmAge (pan-tissue); (c) DNAmAgeHannum; (d) DNAmAgeSkinBlood; (e) DNAmPhenoAge; (f) DNAmTL. Blue dots: non-COPD. Red dots: COPD. Red dotted lines: standard deviation. Black horizontal line: average difference between blood and airway epigenetic age.

