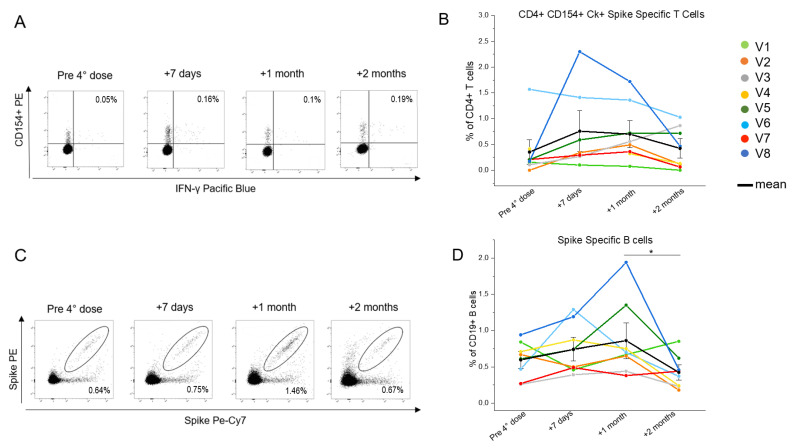
Figure 2.
Evaluation of the SARS-CoV-2-specific circulating CD4+ T and B cells in eight people living with HIV (PLWH), up to 2 months after the fourth vaccine dose. (A) Representative flow cytometric plots of the spike-specific CD154+CD4+IFN-γ+ T cells in one selected individual living with HIV. (B) Kinetic analysis of the frequencies of the CD154+CD4+ T cells producing at least one cytokine among IL-2, IFN-γ, and TNF-α in eight PLWH before, one week, one month, and two months after the fourth vaccine dose. Each color corresponds to a different subject. The T cell evaluation of subject V4 lacks the +7 days timepoint. Black dots indicate mean values. (C) Representative flow cytometric plots of the spike-specific B cells in one selected individual living with HIV. (D) Kinetic analysis of the frequencies of the spike-specific B cells in eight PLWH before, one week, one month, and two months after the fourth vaccine dose. Each color corresponds to a different subject. Black dots indicate mean values * p ≤ 0.05. Error bars indicate SE values.

