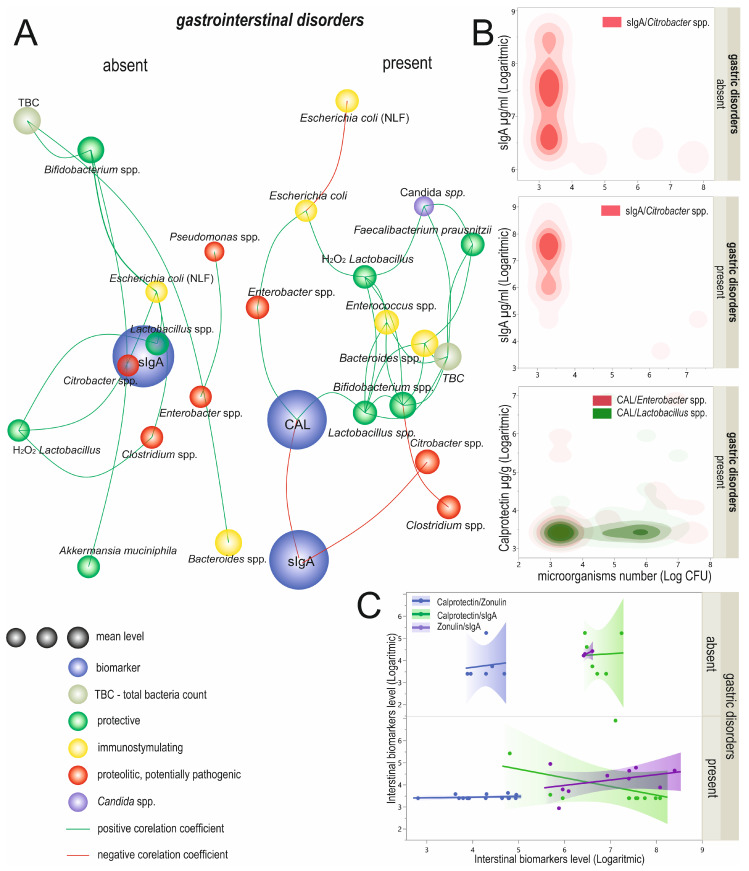
Figure 7.
Linkage distances between analyzed biomarkers and selected microorganisms in groups distinguished according to probiotics usage (A). The length of each line represents the strength of the correlation coefficient. In the case of the circle diameter of microorganisms, the circle size represents the mean level. The biomarker circle size was not scaled. Significant correlations of analyzed biomarkers and microorganism species (B) and correlation between logarithmic transformed biomarkers’ levels (C). CAL—calprotectin; sIgA—secretory immunoglobulin A; ZON—zonulin; TBC—total bacteria count; NLF—non-lactose fermenting; Log CFU—logarithmic transformed colony-forming units.

