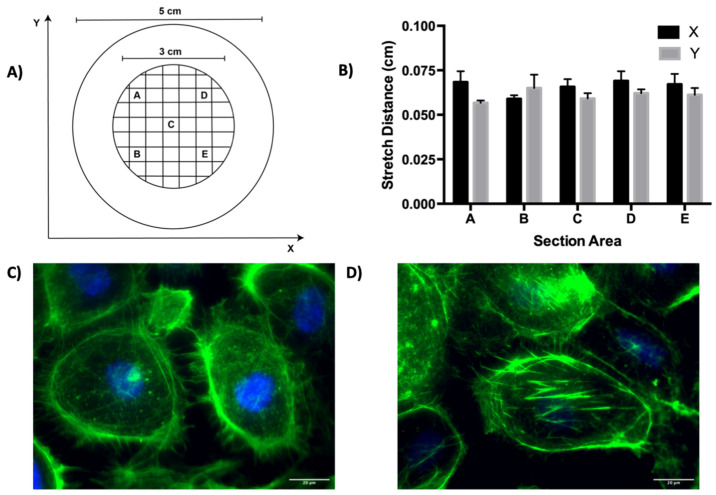
Figure 1.
Calibration of the biaxial stretch system. (A) Schematic of the sectioned PDMS membrane utilized for calibration. Each box (A–E) is 0.25 cm × 0.25 cm. (B) Membrane displacement after stretch at each of the five locations indicated in (A). (C) Fluorescent image demonstrating staining of actin (green) and DAPI counterstain (blue) after 24 h of static culture on a PDMS membrane at 43× magnification. (D) Fluorescent image demonstrating actin staining (green) and DAPI counterstain (blue) after 24 h of biaxial stretch at 43× magnification. Scale bar represents 20 µm.

