Figure 2.
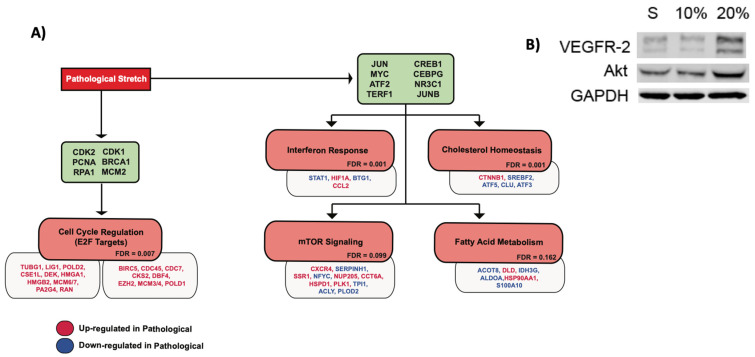
Endothelial response to pathological cyclic stretch. (A) Schematic summarizing the endothelial response to pathological magnitudes of cyclic stretch (20%). Green nodes list sets of upstream regulatory genes that correspond to the downstream cellular responses subsequently listed in red nodes. Downstream cellular responses were identified by GSEA analysis. The false discovery rate (FDR) of each identified gene set is listed. An FDR < 0.25 was utilized as the threshold for further investigation. Relevant target genes within each response are listed below the respective node. Target genes colored red are upregulated at 20% stretch while genes colored blue are downregulated at 20% stretch, relative to the static (no stretch) control. (B) Western blot analysis of protein modulators involved in the E2F response to pathological cyclic stretch. S represents expression after 24 h of static culture, 10% represents expression after 24 h of 10% cyclic stretch, and 20% represents expression after 24 h of 20% cyclic stretch.

