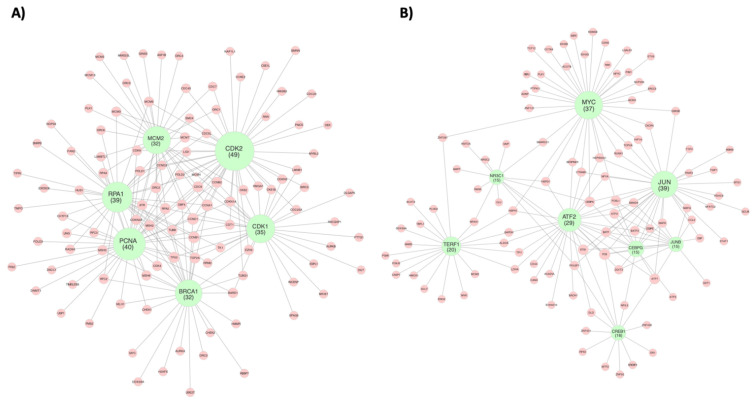
Figure 3.
Regulatory gene networks governing the endothelial response to cyclic stretch. Networks represent (A) endothelial cell cycle regulation and (B) endothelial transcriptional regulation in response to pathological magnitudes of cyclic stretch (20%). Green nodes represent regulatory genes that were identified due to their high number of network connections, which in turn are signified by red nodes representing target genes. Node size of regulatory genes correlates with the number of direct network connections for the respective node. Network was constructed using the GeneMANIA Cytoscape plugin, which utilizes a guilt-by-association approach to map physical interactions between input genes. The input gene list was curated from gene sets identified by GSEA analysis. Only direct first neighbor connections to the regulatory genes are shown here. The full network maps can be seen in Supplementary Figures S1 and S2.

