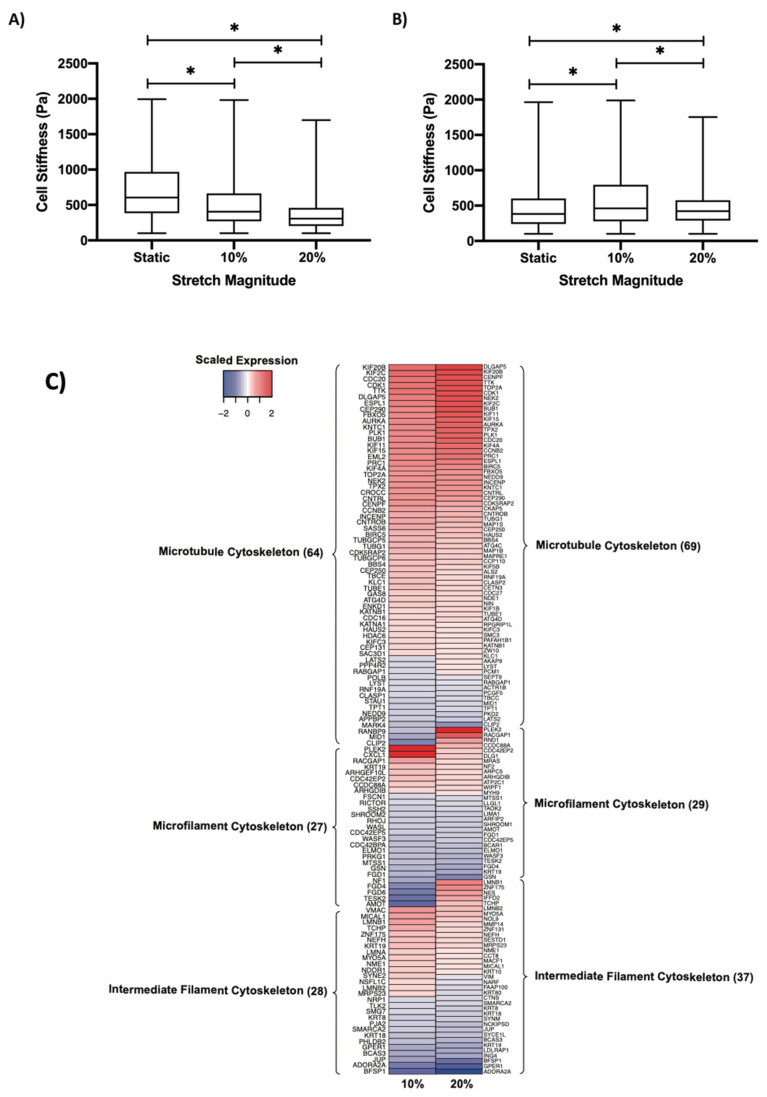
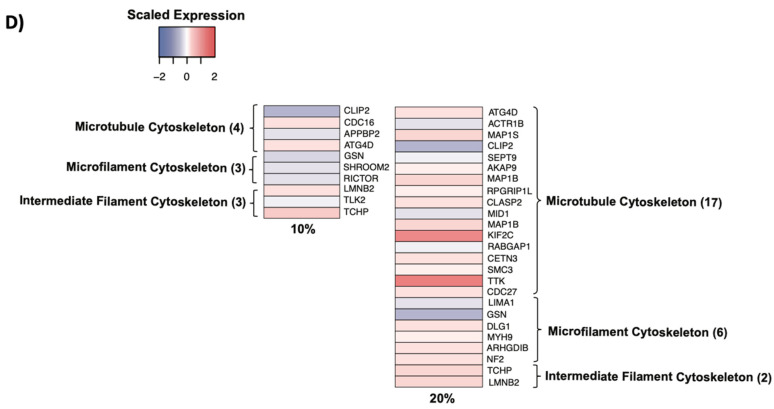
Figure 4.
Regulation of the cytoskeleton by cyclic stretch. Cell stiffness of (A) HUVECs and (B) rapamycin-treated HUVECs as determined through AFM. * indicates p < 0.05 between respective groups. (C) Heatmap demonstrating the expression of cytoskeletal component genes grouped into their respective classifications in response to 10% and 20% stretch. (D) Heatmap demonstrating the expression of cytoskeletal mTOR-target genes grouped into their respective classifications in response to 10% and 20% stretch. For both (C,D), expression was normalized to the static (no stretch) control. Cytoskeletal genes were identified through the Molecular Signatures Database.


