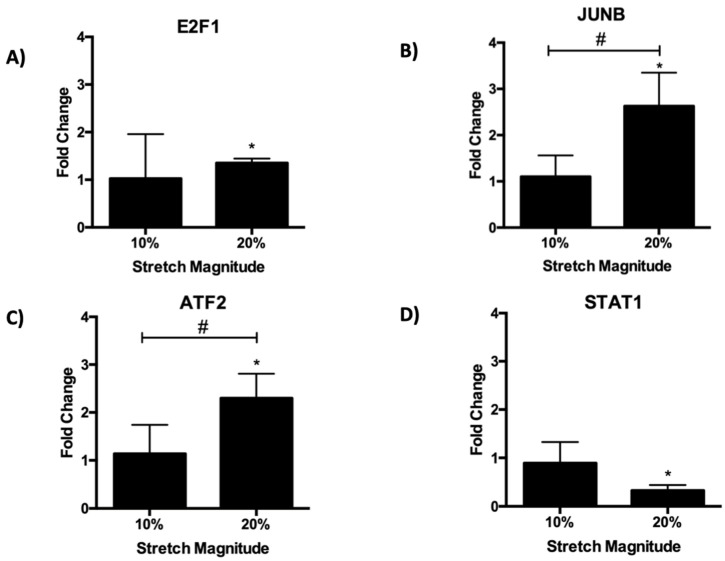
Figure 7.
qPCR validation of RNA-seq. Gene expression of (A) E2F1, (B) JUNB, (C) ATF2, and (D) STAT1 was determined in response to 24 h of 10% and 20% cyclic stretch. Fold change was calculated by normalizing expression to static controls (fold change = 1). * indicates p < 0.05 relative to the static control using one-way ANOVA followed by a post-hoc Fisher’s LSD multiple comparison test, while # indicates p < 0.05 between stretch groups.

