Figure 1.
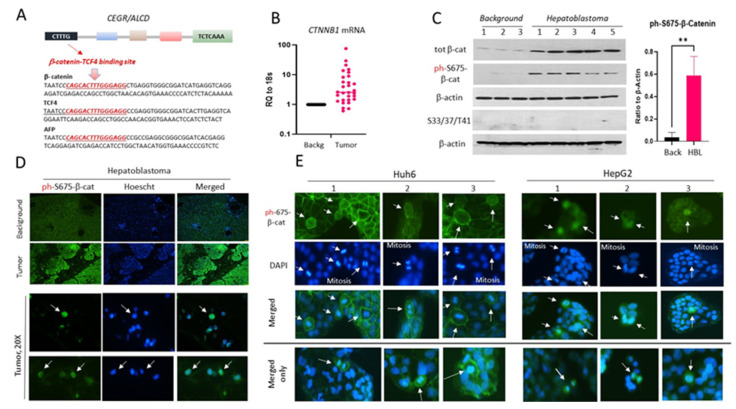
Ph-S675-β-catenin is increased in patients with aggressive HBL and in HBL cell lines HepG2 and Huh6. (A) Structure of the CEGRs/ALCDs in cancer genes is shown. Black box shows TCF4 binding sites in the CEGRs/ALCDs of β-catenin, TCF4, and AFP genes. (B) Levels of CTNNB1 (β-catenin) mRNA in fresh HBL biobank (n = 32) (p = 0.0127, unpaired t-test) (C) Levels of total β-catenin and ph-S675-β-catenin in background and tumor regions of HBL. Bar graph shows levels of ph-S675-β-catenin as a ratio to β-actin (p = 0.0017, unpaired t-test). (** p ≤ 0.05) (D) IF staining of livers of HBL patients with antibodies to ph-S675-β-catenin and stained with DAPI. Arrows indicate nuclear localization of ph-S675-β-catenin. (E) ph-S675-β-catenin is elevated in mitotic (shown by arrows) Huh6 and HepG2 cells. The uncropped Western blots have been shown in Figure S9.

