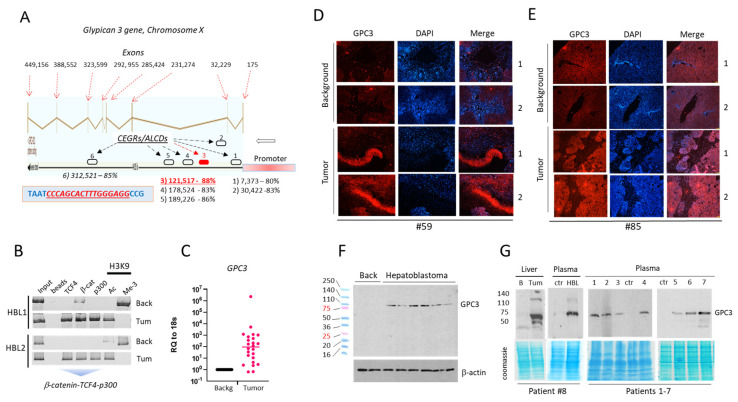
Figure 3.
GPC3 is elevated in HBL patients by β-catenin-TCF4-p300 pathway via CEGRs/ALCDs in GPC3 gene. (A) Structure of the GPC3 gene. The 100% homologous TCF4 binding site is shown in the blue box. (B) ChIP assay with the third CEGR/ALCD of GPC3. (C) GPC3 mRNA expression in a fresh biobank of HBL samples (n = 32) (p = 0.3202, unpaired t-test). (D,E) IF staining of pediatric liver cancer sections with antibodies to GPC3. (F) GPC3 expression in specimens from a fresh biobank was determined by Western blot. (G) Levels of GPC3 in blood of eight HBL patients with active ph-S675-β-catenin-TCF4-CEGRs/ALCDs-GPC3 pathway in liver tumors. The uncropped Western blots have been shown in Figure S9.

