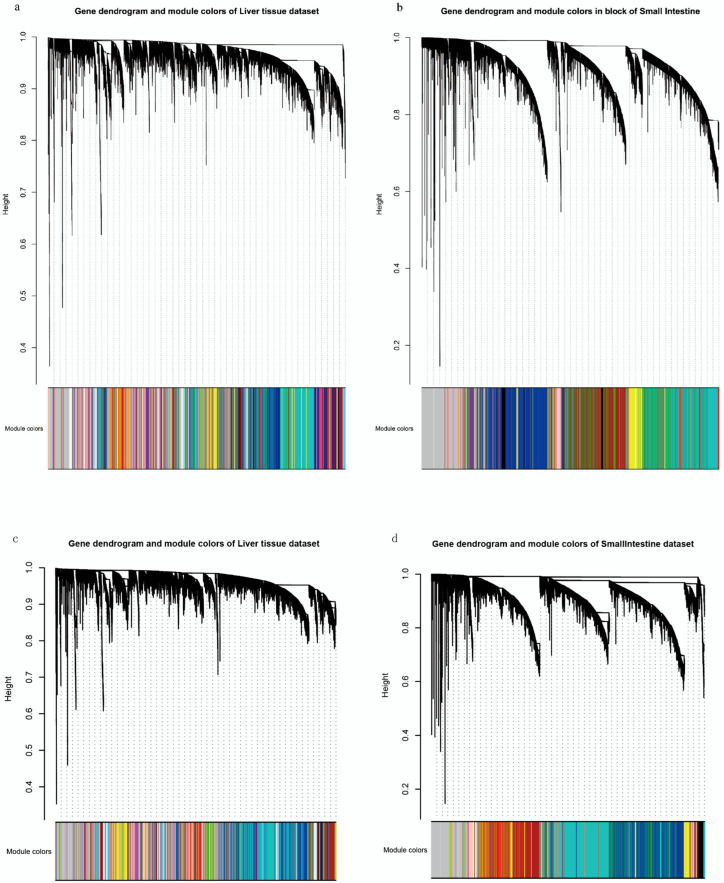
Figure 2.
Gene clustering tree and module identification. The top halves of the four plots represent the gene clustering tree constructed based on topological overlap, and the height on the y-axis represents distance between modules; the higher the height value, the less likely it is that the two modules are co-expressed. The lower half of each of the four plots represents the gene modules, and each colored row represents a color-coded module that contains a group of highly connected genes. (a) The first group, (b) second group, (c) third group and (d) fourth group.

