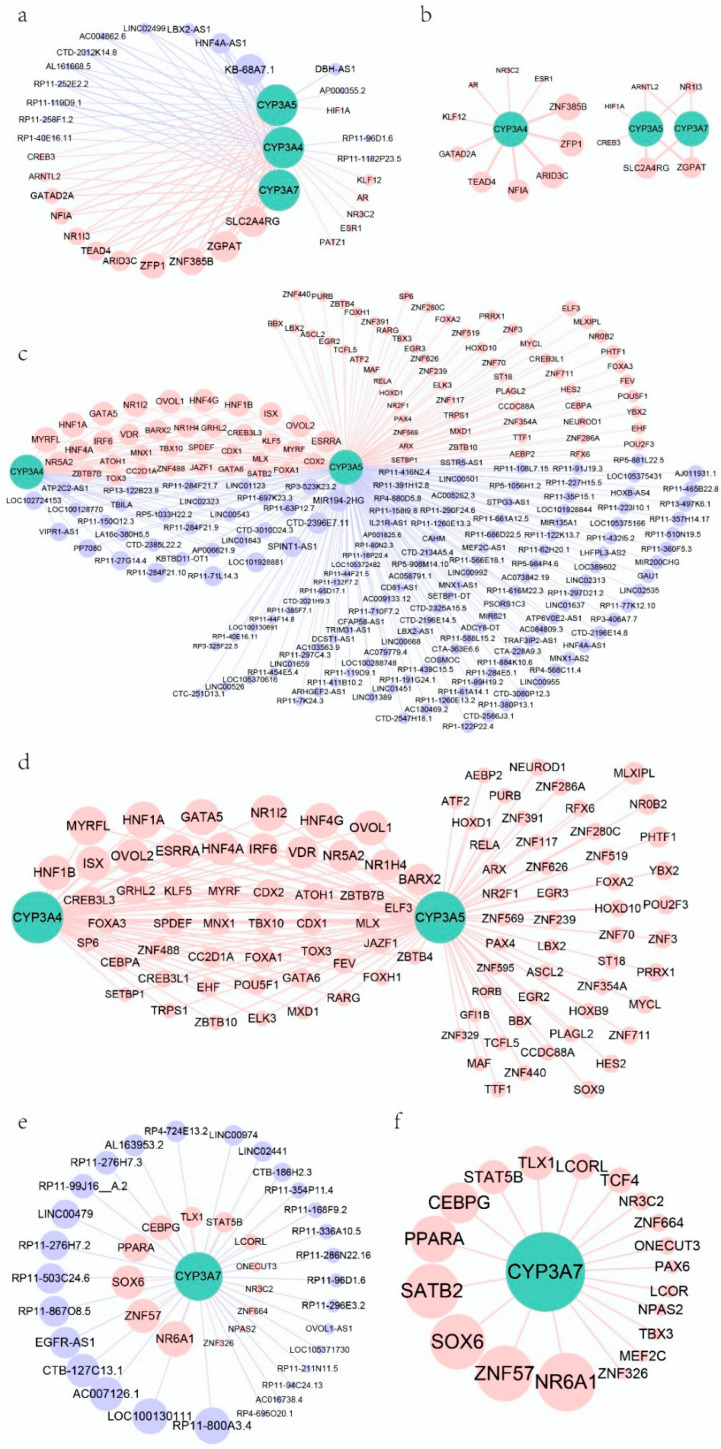
Figure 4.
The direct co-expression relationships among TFs, lncRNAs, and CYP3A4, 3A5, and 3A7. (a) The co-expression network of TFs, ncRNAs, and CYP3As in group 1 and all TFs and ncRNAs with weight values > 0.1. (b) The co-expression network in group 3 (weight value > 0.1). (c) The co-expression network of TFs, ncRNAs, CYP3A4, and 3A5 in group 2. (d) The co-expression network of TFs, CYP3A4, and 3A5 in group 4 (weight value > 0.2). (e) The co-expression network of TFs, ncRNAs, and CYP3A7 in group 2. (f) The co-expression network of TFs and CYP3A7 in group 4 (weight value > 0.1). The thicker the edges in (a,b), the larger the weight values. The larger the dots in (a–f), the larger the weight values. The size of dots represents weight value with CYP3A5 when there is more than one relationship among TFs, ncRNAs, and CYP3As. The red and blue dots represent TFs and ncRNAs, respectively.

