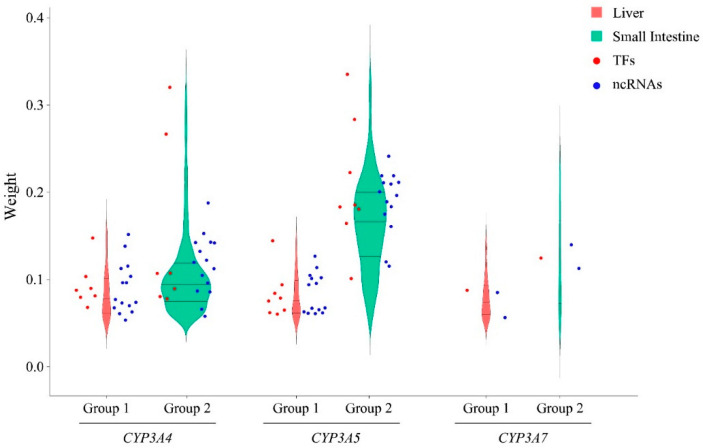
Figure 6.
Comparison of CYP3A expression regulatory networks between liver and small intestine. The y-axis displays the weight values calculated by WGCNA. Red and blue dots represent the overlapping TFs and ncRNAs associated with each CYP3A in the liver and small intestine, respectively. The red and green violin plots represent all TFs and ncRNAs associated with each CYP3A in the liver and small intestine, respectively.

