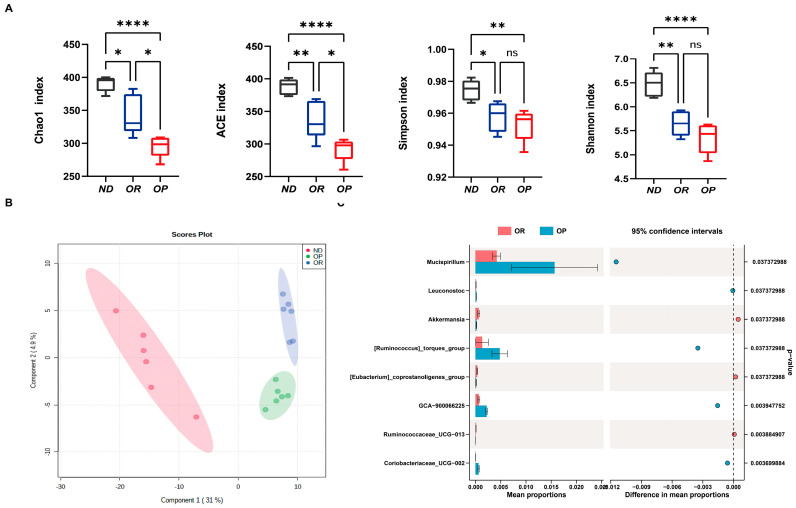
Figure 2.
Significantly different microbiota structures were observed between OR and OP groups. (A) Comparison of alpha diversity indices in the OR versus OP groups. (B) Partial least-square discriminant analysis (PLS-DA) scores plot of OTU level showing the groupings of ND (red) group, OP (green), and HF-OR (blue). (C) Extended error bar plot between the OP and OR groups at the genus level. * p < 0.05, ** p < 0.01 and **** p < 0.0001 were considered significant. ns, not significant.

