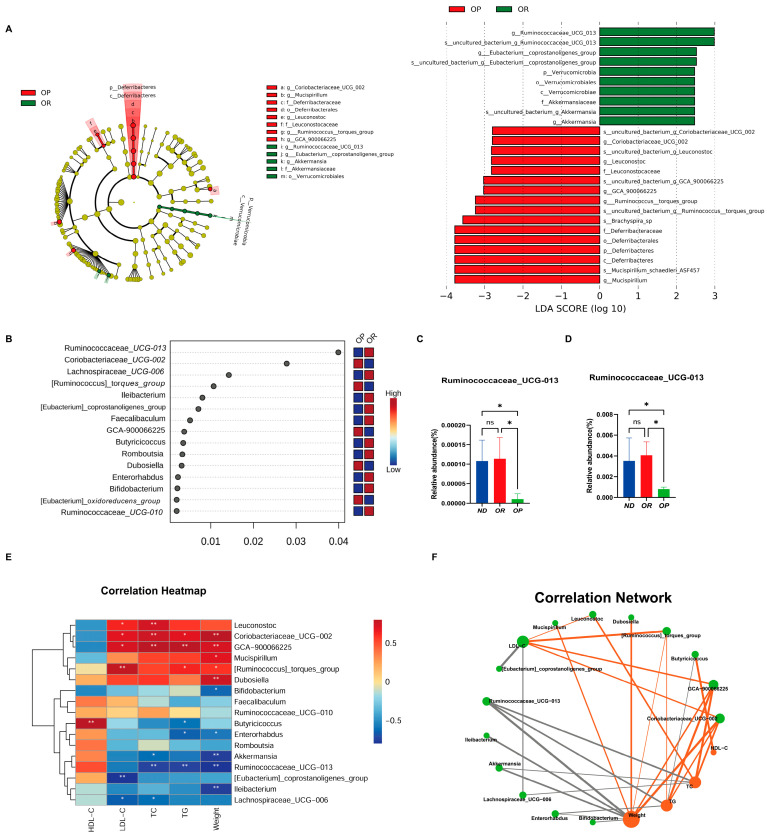
Figure 3.
The specific gut microbiota linked to the development of obesity according to the machine learning algorithm. (A) Linear discriminant analysis (LDA) effect size (LEfSe) analyses identified bacterial biomarkers of OP and OR mice (LDA > 2, p < 0.05). (B) Ranking of species importance produced by random forest analyses. (C) The relative abundance of Ruminococcaceae_UCG-013 in different groups at week 8. (D) The relative abundance of Ruminococcaceae_UCG-013 in different groups at week 16. (E) Heatmap of Spearman’s correlation between the faecal microbiota with significant differences and serum biochemical parameters and body weight. An indicator of the degree of association is the intensity of the colour. (F) Co-occurrence network. Note: p < 0.05, confidence interval = 95%; green nodes are gut microbial genera; orange nodes are serum biochemical indicators; orange and black lines represent positive and negative correlations, respectively. In addition, the width of the lines indicates the strength of the correlation. * p < 0.05. ** p < 0.01. ns, not significant.

