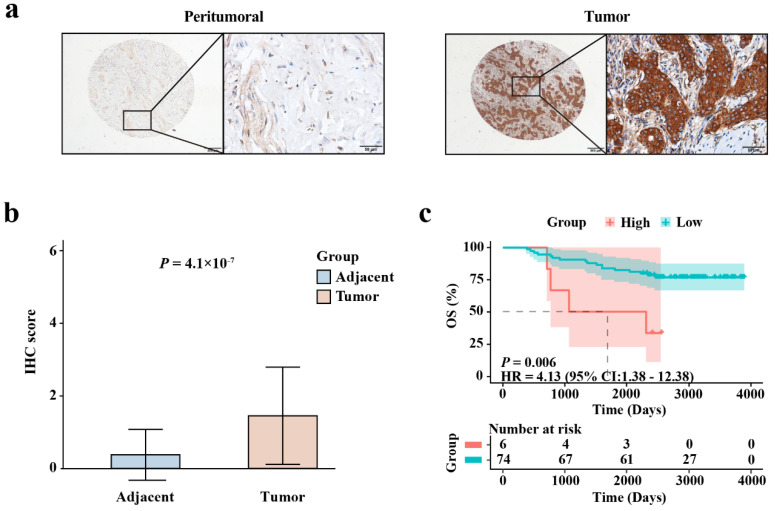
Figure 7.
IHC staining validating the expression level and prognostic value of EIF4G1 in BRCA. (a) Representative IHC images of EIF4G1 in tumors and non-cancerous breast tissues. Scale bars were 500 μm and 50 μm; (b) Expression level of EIF4G1 in BRCA tissues and non-cancerous breast tissues; (c) Differences in OS between EIF4G1 high- and low-expression groups, as determined with the KM curve.

