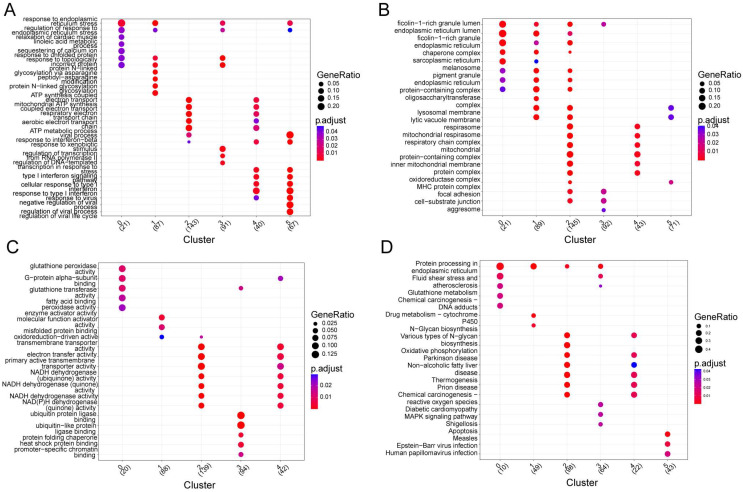
Figure 3.
Functional enrichment analysis of genes within sub-clusters. (A) Functional enrichment analysis was conducted using the Reactome pathway database; each circular symbol represents an individual pathway. (B–D) Enriched GO_MF (B), GO_CC (C), and GO_BP (D) pathway annotation of marker genes within different sub-clusters.

