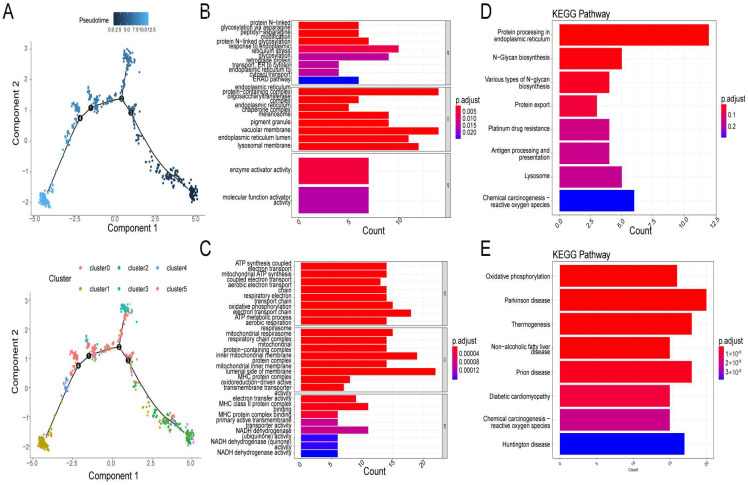
Figure 4.
Reconstruction of a cell trajectory by monocle single-cell trajectory analysis. (A) Monocle reconstructed two main branches from a single cell trajectory. Branch 1 contains cluster 1 and cluster 4, branch 2 contains cluster 2 and cluster 5. Cells are colored based on state (left), and cluster (right). Cells in different branches have different cellular differentiation characteristics. (B–E) Gene ontology (GO) enrichment analysis and KEGG pathway analysis for branch−dependent genes. GO enrichment analysis (B) and KEGG pathway analysis (D) of differentially expressed genes (DEGs) in branch1. GO enrichment analysis (C) and KEGG pathway analysis (E) of DEGs in branch2.

