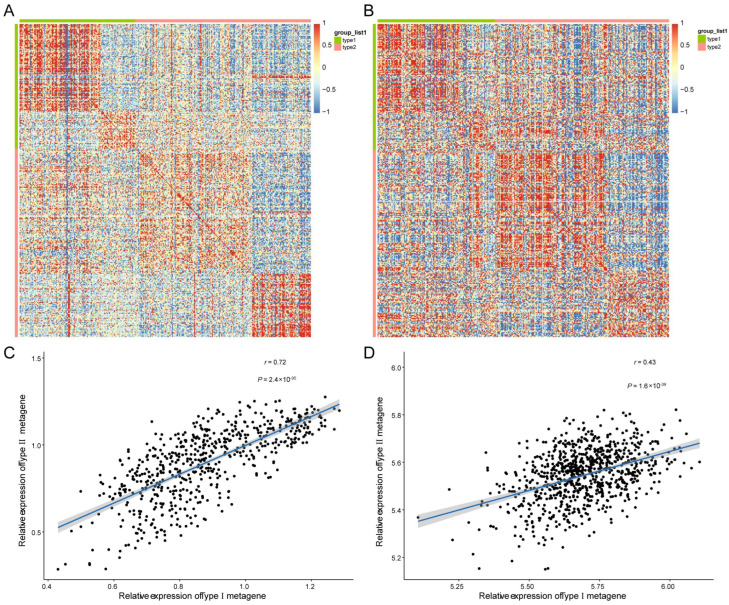
Figure 5.
Correlation of bulk and scRNA-seq datasets. (A) Heatmap visualization of the DEGs associated with two cell differentiation branches in scRNA-seq datasets. (B) Heatmap visualization of the DEGs associated with two cell differentiation branches in TCGA dataset. (C) Correlation analysis of metagene scores of Type I and type II marker genes in scRNA-seq dataset. (D) Correlation analysis of metagene scores of Type I and type II marker genes in scRNA-seq dataset.

