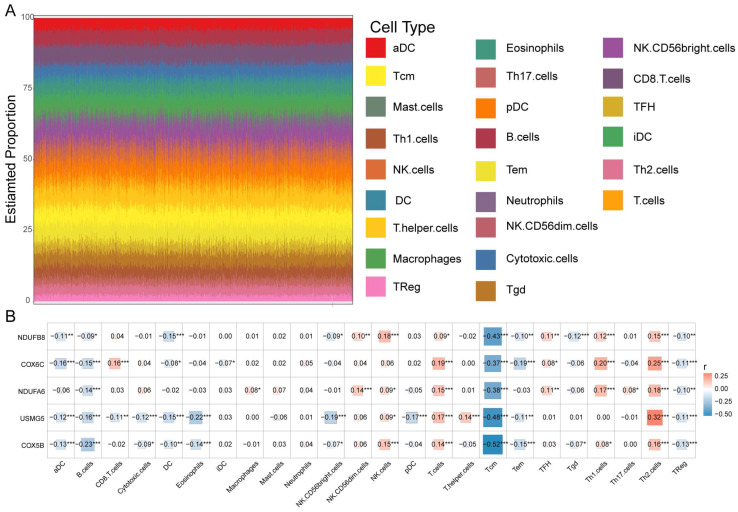
Figure 8.
Correlation of immune microenvironment with prognostic hub genes. (A) Stacking diagram for immune cell infiltration based on ssGSEA score. (B) Correlation between the expression of NDUFB8, NDUFA6, COX5B, COX6C, USMG5, and different immune cell infiltration. * p < 0.05, ** p < 0.01, *** p < 0.001.

