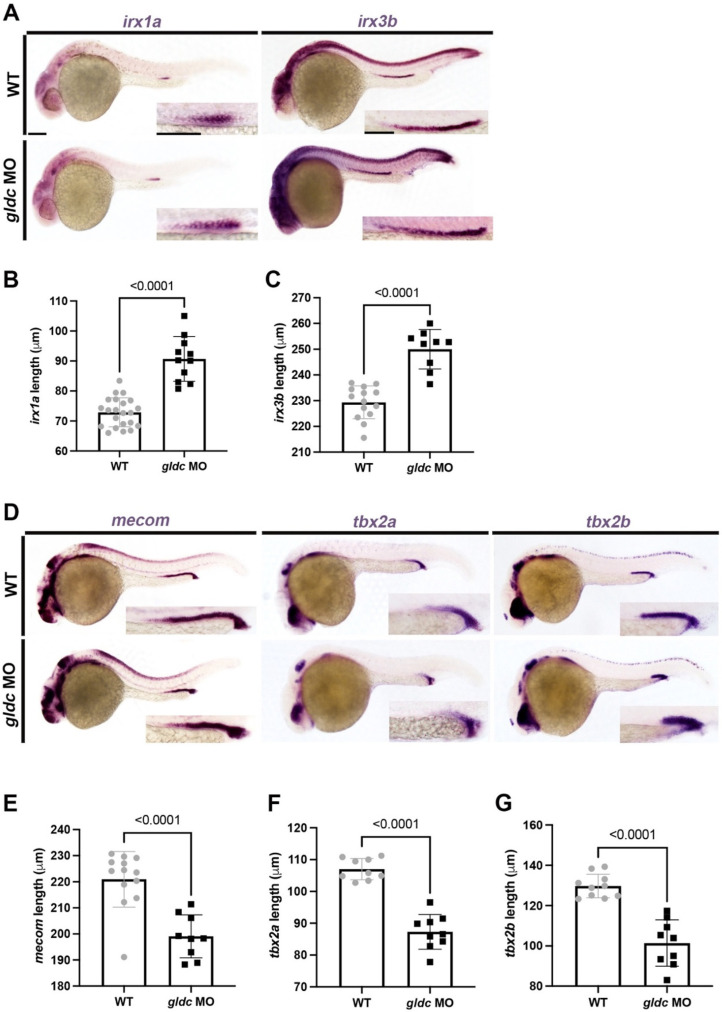
Figure 4.
Loss of gldc affects DE and DL precursor populations. (A) WISH of irx1a and irx3b in WT and gldc morphant embryos at 24 hpf. Scale bars = 100 μM (main image) and 50 μM (inset). (B,C) Absolute length measurements of irx1a and irx3b domains. (D) WISH of mecom, tbx2a, and tbx2b on WT and gldc MO embryos at 24 hpf. Scale bars = 100 μM (main image) and 50 μM (inset). (E–G) Absolute length measurements of mecom, tbx2a, and tbx2b domains quantified for each control and experimental group. Data are mean ± s.d. Absolute lengths were compared using unpaired T-tests.

