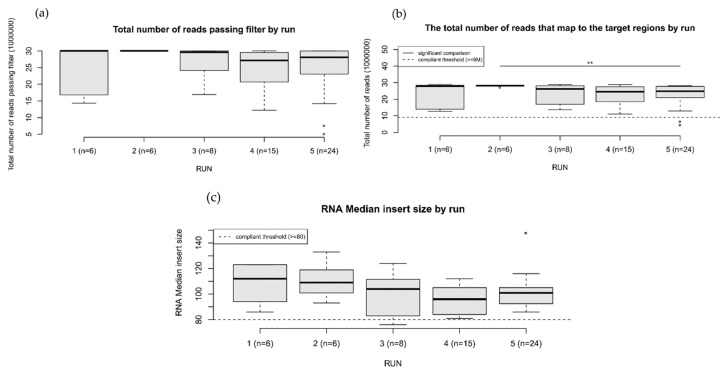
Figure 3.
RNA sequencing quality metrics over 59 samples. Each boxplot shows the metrics distribution for the five runs. Pairwise comparisons between runs were done through a two-sided Wilcoxon rank-sum test (p-value: ** < 0.01). (a) Total number of reads passing (quality score > 30). (b) Total number of reads mapping to the target regions. (c) Mean read length (bp) by run.

