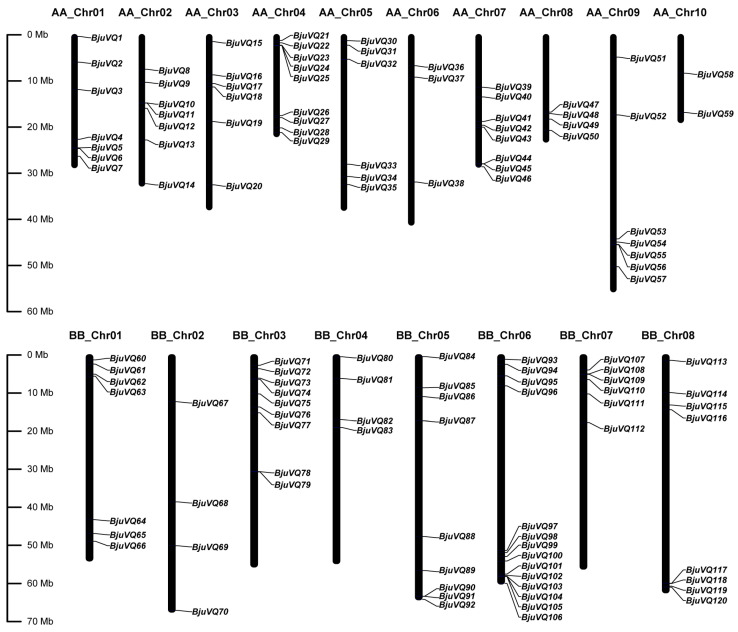
Figure 4.
Distribution of the 120 BjuVQ genes in the mustard genome. The vertical black columns represent chromosomes with the gene names shown on the right. Chromosome numbers are listed above, while chromosome sizes are indicated on the left side of the figure. The length of each chromosome on the left was estimated in mega base (Mb).

