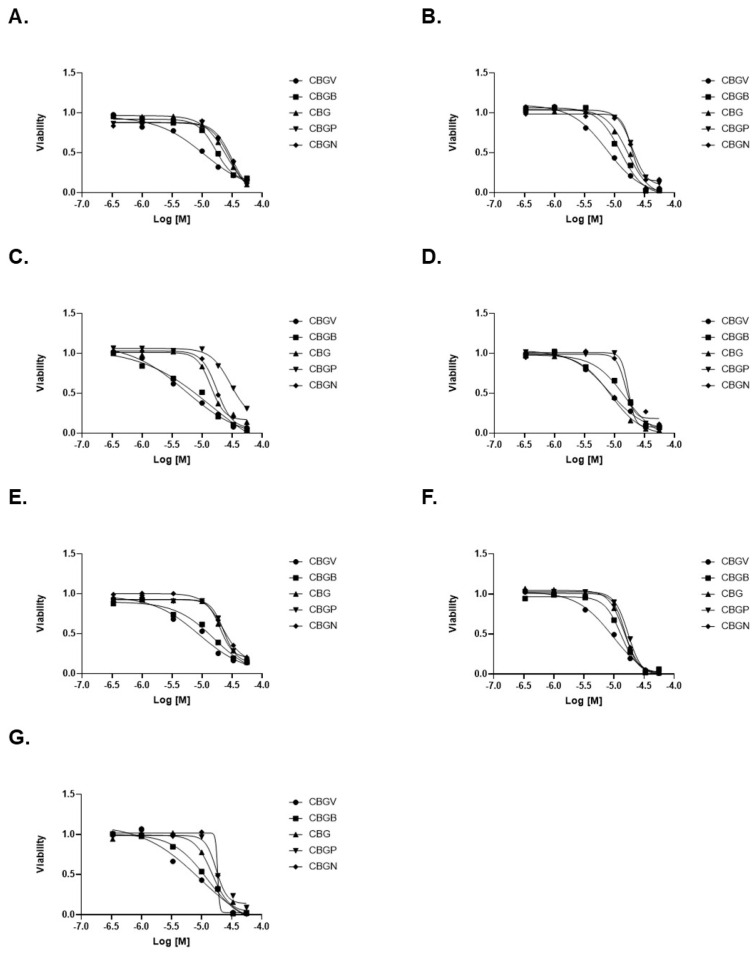
Figure 2.
Dose response curves of CBG side-chain variants on colorectal cancer cell viability. Colorectal cancer cell lines were treated with varying doses of cannabinoid for 48 h and then viability was measured using the MTT assay. Representative dose response curves are shown for (A) SW480, (B) SW620, (C) HT29, (D) DLD-1, (E) HCT116, (F) LS174, and (G) RKO cell lines.

