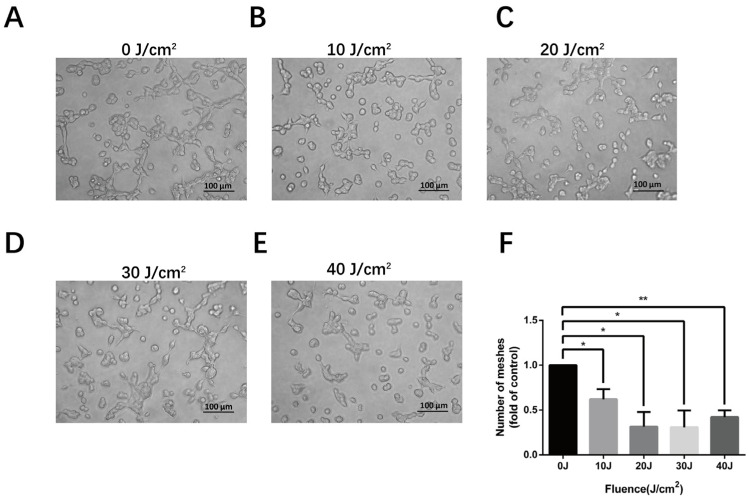
Figure 3.
The suppression of tube formation in HMEC-1 after 590 nm LED irradiation. (A–E) The cell tube formation condition 8 h after 0–40 J/cm2 LED irradiation. (F) The comparison of mesh numbers. Data are normalized to the control and are shown as mean values with SD from three independent tests. *, p < 0.05; **, p < 0.01. Bar, 100 μm.

