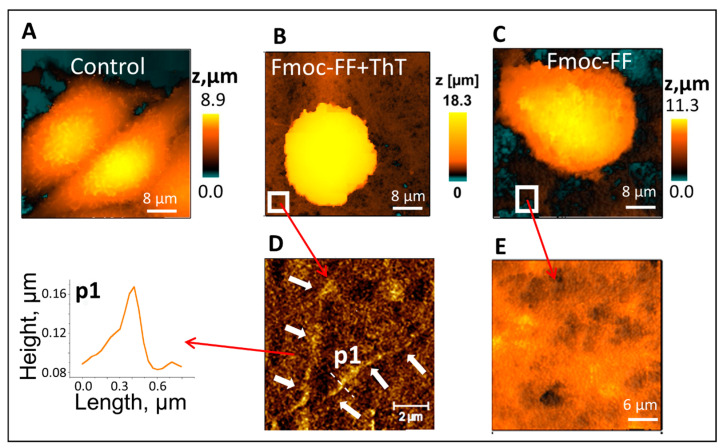
Figure 2.
SICM topography imaging of the hydrogels and living cells grown on them. (A–C) The topography of living cells (MCF-7) grown on (A) control substrate, (B) Fmoc-FF+ThT hydrogel, (C) Fmoc-FF hydrogel. (D,E) The topography of (D) Fmoc-FF+ThT and (E) Fmoc-FF hydrogel. In the insert of figure (D), an image of a single fibril is shown. White arrows show single fibrils topography of the Fmoc-FF+ThT system. Concentrations: Fmoc-FF = 5 mg/mL, ThT = 40 µM.

