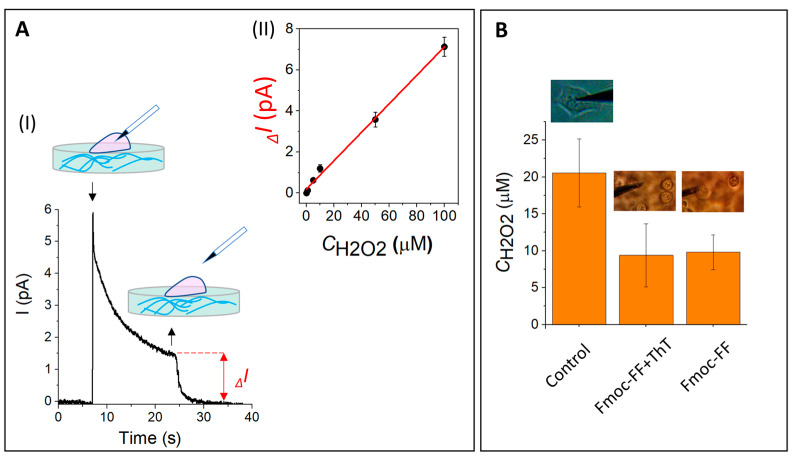
Figure 4.
ROS assessment in living cells using the SICM technique. (A(I)) Current versus time plot inside and outside MCF-7 cells grown on a Petri dish (control). The “down” arrows indicate the moment of penetration inside the cells and the “up” arrows indicate the moment of retraction of the sensor from the cells, respectively. (A(II)) The electrode calibration curve for H2O2. (B) The H2O2 content for MCF-7 cells grown on the control substrate, Fmoc-FF + ThT hydrogel and Fmoc-FF hydrogel. Above the data the photos of electrode and the cells with their characteristic forms placed on control, Fmoc-FF + ThT and Fmoc-FF substates can be seen.

