Figure 4.
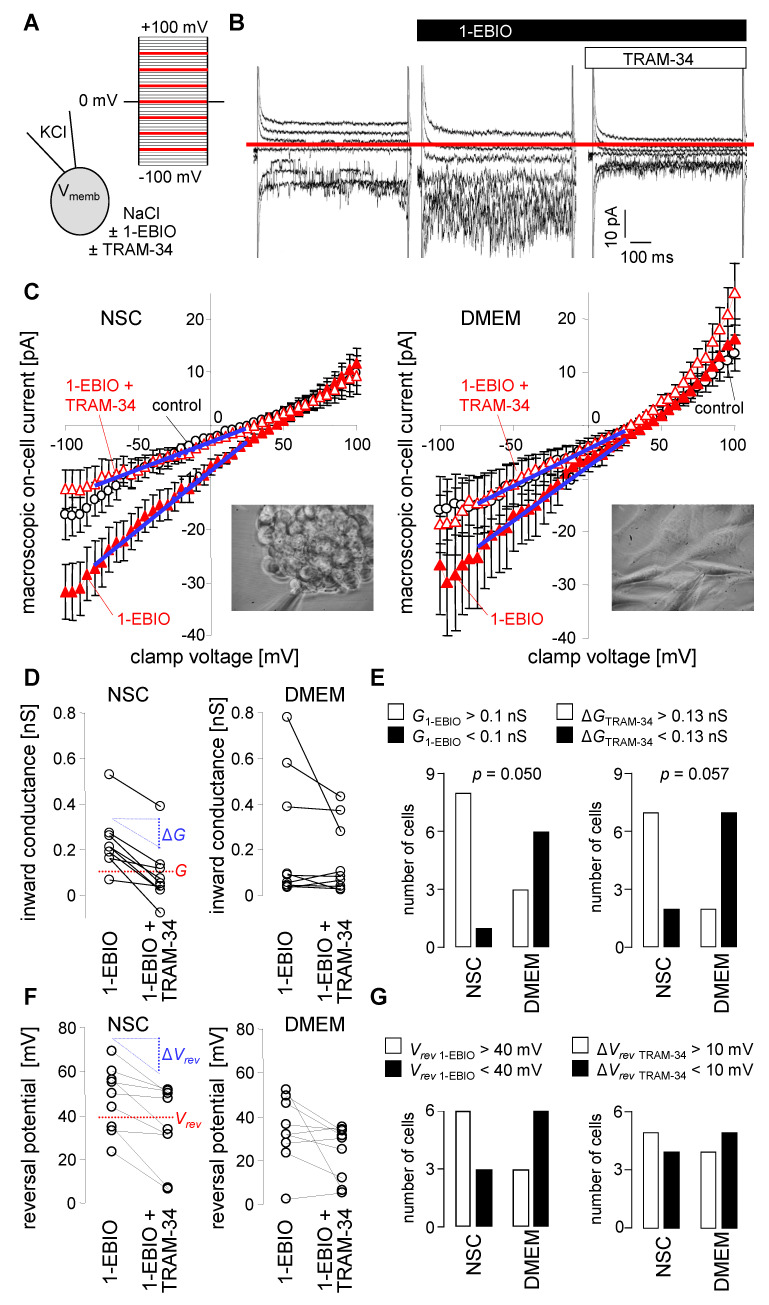
NSC culture conditions induce upregulation of KCa3.1 K+ currents in the plasma membrane of SMA-540 mouse glioma cells (A,B). Ionic composition with channel modulators of pipette and bath solution and applied voltage pulse protocol (A) used to record macroscopic on-cell (cell-attached) currents from an NSC-grown (10–14 d) SMA-540 cell. On-cell current tracings depicted in (B) were obtained before (left), during bath application of the KCa3.1 K+ channel opener 1-EBIO (200 µM) alone (middle) or in combination with the KCa3.1 inhibitor TRAM-34 (1 µM, right). For better readability, only current tracings elicited by voltage square pulses to −75, −50, −25, 0, +25, +50, and +75 mV are shown; red line in (B) indicates 0 pA (C). Dependence of macroscopic on-cell currents on clamp voltage in NSC- (left) and DMEM-grown (right) SMA-540 cells recorded before (control, open black circles), during bath application of 1-EBIO (closed red triangles) and co-application of 1-EBIO and Tram-34 (open red triangles). Data are means ± SE, n = 9; the inserts in the lower right corner of the plots show light micrographs of a SMA-540 spheroid (left) and a SMA-540 monolayer (right) during patch-clamp recording (D). Paired conductances as calculated for the inward currents from the data summarized in (C) in NSC- (left) and DMEM-grown (right) SMA-540 cells recorded successively with 1-EBIO and 1-EBIO/TRAM-34 in the bath solution. Given are individual values determined for that range of clamp voltage indicated in (C) by blue lines (E). Two-by-two contingency plots showing the number of NSC- and DMEM-grown SMA-540 cells with an on-cell inward conductance in 1-EBIO-containing bath solution (G1-EBIO) of above (closed columns) and below (open columns) 0.1 nS (left) as well as with a TRAM-34-induced inward conductance decline (ΔGTRAM-34) of above (closed columns) and below (open columns) 0.13 nS (right). Data are from (D), indicated p values refer to the difference between the culture conditions and were calculated with chi square test (F). Paired reversal potentials (Vrevs, individual values) as given for the data summarized in (C) in NSC- (left) and DMEM-grown (right) SMA-540 cells recorded successively with 1-EBIO and 1-EBIO/TRAM-34 in the bath solution (G). Two-by-two contingency plots showing the number of NSC- and DMEM-grown cells with a Vrev in 1-EBIO-containig bath solution (Vrev 1-EBIO) of above (closed columns) and below (open columns) +40 mV (left) as well as with a TRAM-34-induced drop in Vrev (ΔVrev TRAM-34) by above (closed columns) and below (open columns) 10 mV (right).

