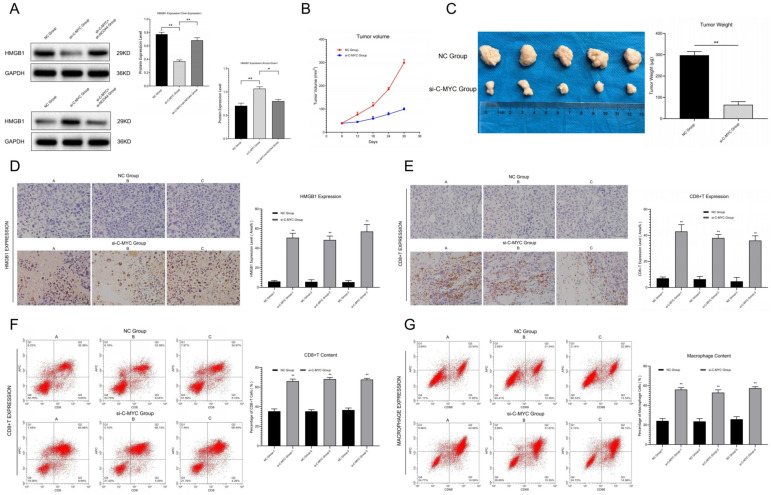
Figure 4.
(A) Detection and statistical analysis of HMGB1 content in the supernatant of ovarian cancer cells after transfection. (B) Tumor growth curve in vivo condition. (C) Detection of tumor weight in in vitro condition and data analysis. (D) Relative HMGB1 expression between NC Group and si-C-MYC Group were detected and analyzed by means of immunohistochemistry. (E) Immunohistochemical staining and analysis of immune infiltration between the NC group and the si-C-MYC group (CD8+T). (F,G) Detection of CD8+T/macrophage cells through flow cytometry and statistical analysis (* p < 0.05, ** p < 0.01).

