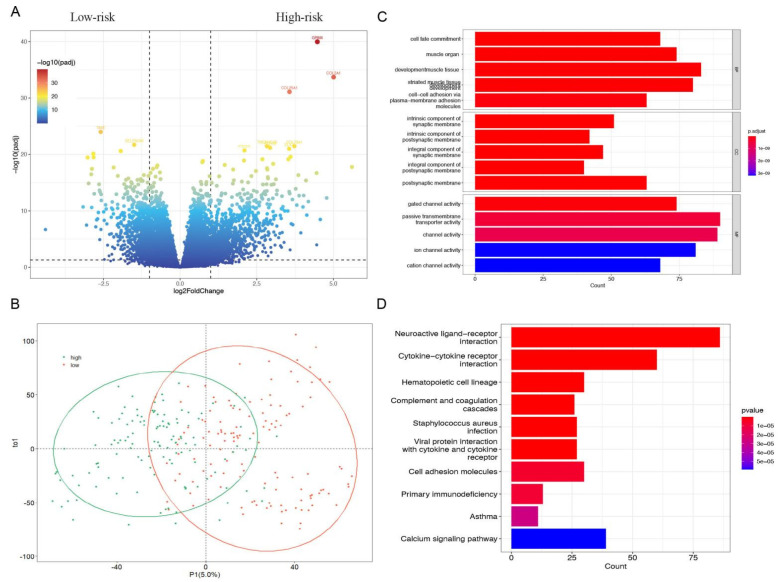
Figure 4.
Exploring of DEGs of high- and low-risk groups in patients with sarcoma. (A) The result of a volcano plot. The dots on the right site indicated the high-risk genes, the dot on the left site is the low-risk genes, and the in-between dots indicated the other genes without significant difference. (B) The result of PLS-DA indicated the two groups of people could be clearly distinguished in the model. (C,D) The GO functional enrichment analysis of differential genes includes three domains: molecular function (MF), biological process (BP), and cell composition (CC). KEGG pathway analysis of differentially expressed genes.

