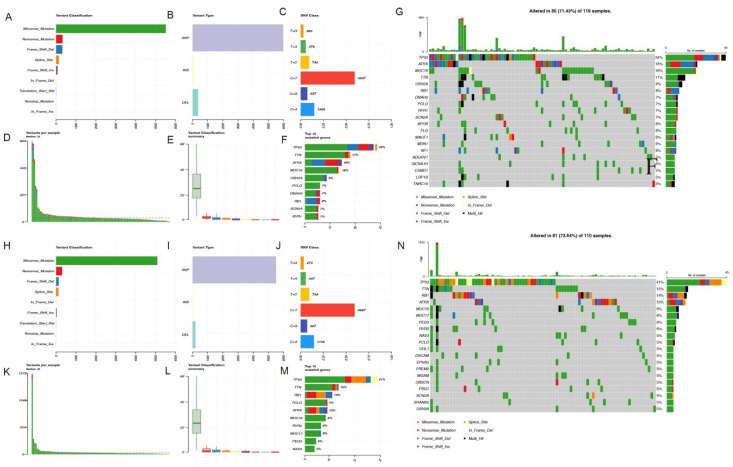
Figure 10.
Mutation landscape. (A–H) Variant classification. X axis indicated variant numbers. Y axis showed different variant classifications. (B–I) Variant type. X axis indicated variant numbers. Y axis represented different variant types. (C–J) SNVs type. X axis indicated the ratio. Y axis represented the type of nucleotide substitution. (D–E, K–L) The variants per sample and the summary of variant classification. Each sample contains a statistical plot of the number of mutations and a box plot of the classification of the various mutations in the sample (F–M) Top10 mutated genes. X axis indicated variant numbers. Y axis represented different genes. The genes were ordered by their mutation frequency.) (G–N) The upper bar shows the total gene mutation amount and corresponding mutation types. The right bar shows the mutation frequency of the top 20 mutated genes.

