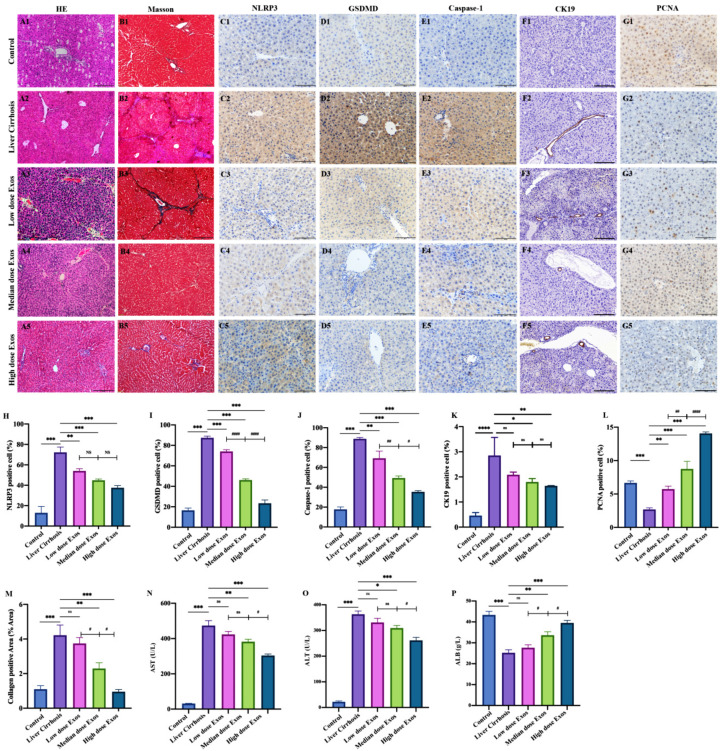
Figure 5.
The therapeutic effect of Exo-BMMSC on liver cirrhosis was assessed in pathological sections and by measuring liver function. HE-stained sections from the control, liver cirrhosis and exosome treated groups are shown (A). Masson-stained sections from the different treatment groups are shown (B). Semi-quantitative analysis of the collagen-positive area showed that the areas in the medium dose and the high dose Exos-rBMMSC groups were significantly decreased compared with those in the liver cirrhosis group ((M), ** p < 0.01). The collagen area in the medium dose Exos group was significantly lower than that in the low dose Exos group but was higher than that in the high dose Exos group ((M), # p < 0.05). NLRP3-, GSDMD-, caspase-1-, CK19- and PCNA-positive cells were assessed by immunohistochemistry (C–G). Semi-quantitative analysis showed that NLRP3-, GSDMD-, caspase-1- and PCNA- positive cells in all the Exos treatment groups were significantly lower than those in the liver cirrhosis group ((G–K), ** p < 0.01). The CK19-positive cells in the low dose Exo group had no significant significance compared to the liver cirrhosis ((K), p > 0.05). The NLRP3-positive cells and the CK19- positive cells in the medium dose Exos group were not significantly different from those in the low dose and the high dose Exos groups (H,K). The numbers of GSDMD- and caspase-1-positive cells in the medium dose Exos group were dramatically lower than those in the low dose Exos group but were higher than those in the high dose Exos group ((I,J), # p < 0.05). The numbers of PCNA- positive cells in the medium dose Exos group were significantly higher than those in the low dose Exo group but lower than those in the high dose group ((L), ## p < 0.01). AST and ALT expression in the medium dose and the high dose Exos groups was significantly decreased, but ALB expression was significantly increased compared to that in the liver cirrhosis group ((N–P), * p < 0.05). The expression of AST and ALT in the high dose Exos group was dramatically lower ((N–O), *** p < 0.001 vs. Liver cirrhosis group), while the expression of ALB was higher than that in the medium dose Exos group ((P), # p < 0.05). The data are displayed as the means ± SD.

