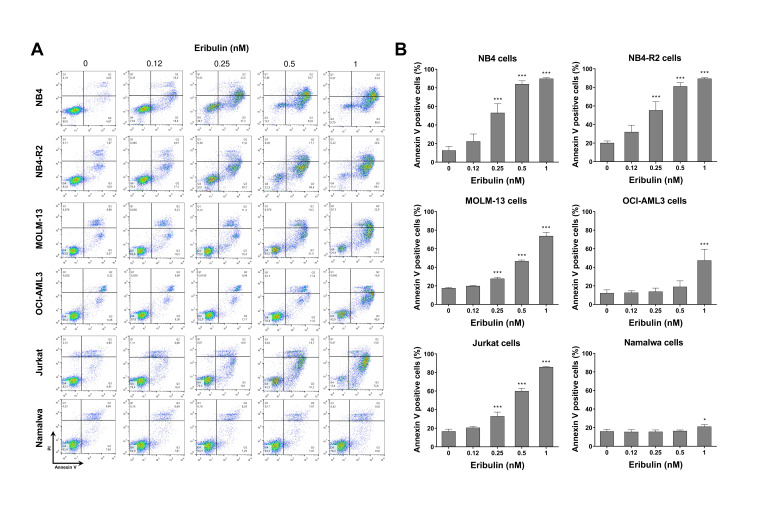
Figure 2.
Eribulin triggers apoptosis in leukemia cells. (A) Apoptosis was detected by flow cytometry in NB4, NB4-R2, MOLM-13, OCI-AML3, Jurkat, and Namalwa cells treated with graded concentrations of eribulin (0.12, 0.25, 0.5, and 1 nM) for 72 h using the annexin V/propidium iodide staining method. Representative dot plots are shown for each condition; the upper and lower right quadrants (Q2 + Q3) cumulatively contain the apoptotic population (annexin V+ cells). (B) Bar graphs represent the mean ± SD of at least four independent experiments quantifying apoptotic cell death. The p values and cell lines are indicated in the graphs; * p < 0.05, *** p < 0.0001; ANOVA test and Bonferroni post-test.

