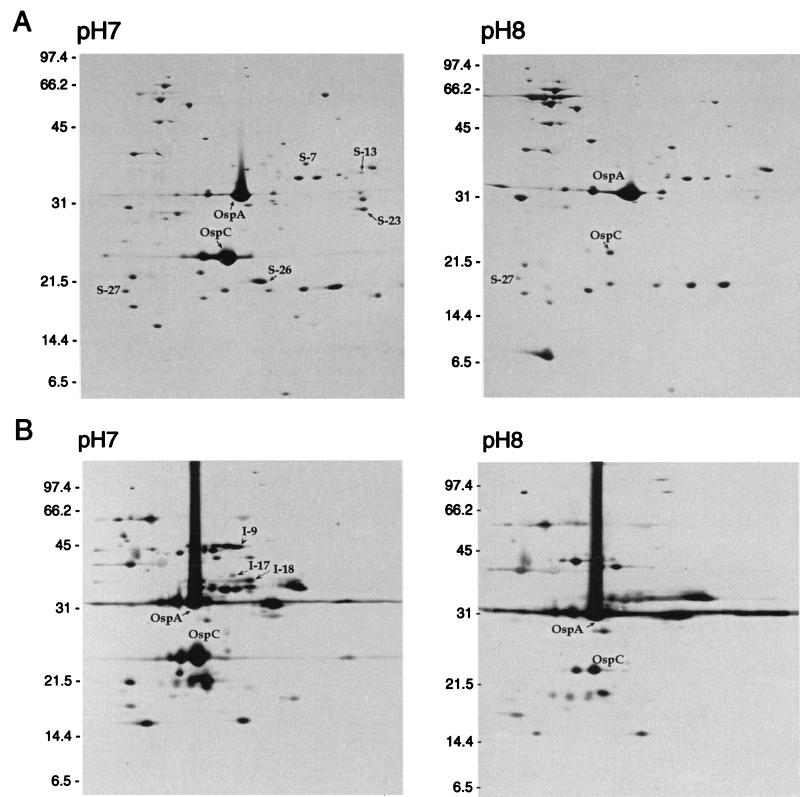
FIG. 1.
Comparison of 2D-NEPHGE membrane protein profiles from B. burgdorferi B31 grown at pH 7.0 and 8.0 by silver staining (A) and by immunoblotting and probing with hyperimmune serum (B). 2D-NEPHGE profiles were reproduced from reference 5. The acidic ends are to the left. OspA and OspC are indicated as reference marks. Molecular mass standards in kilodaltons are indicated on the left of each panel.

